")
")
| Issue |
Int. J. Simul. Multidisci. Des. Optim.
Volume 12, 2021
Computation Challenges for engineering problems
|
|
|---|---|---|
| Article Number | 1 | |
| Number of page(s) | 8 | |
| DOI | https://doi.org/10.1051/smdo/2021001 | |
| Published online | 2021年5月05日 | |
Research Article
CFD modelling of airborne virus diffusion characteristics in a negative pressure room with mixed mode ventilation
School of Mechanical Engineering, Vellore Institute of Technology, Chennai, Tamil Nadu 600127, India
* e-mail: 该Email地址已收到反垃圾邮件插件保护。要显示它您需要在浏览器中启用JavaScript。
Received:
10
January
2021
Accepted:
12
March
2021
Abstract
COVID-19 caused by severe acute respiratory syndrome (SARS) has accounted for huge collateral damage and as the virus is spreading faster and faster this study deals with isolation rooms or negative pressure rooms with 12 or more air changes per hour and maintaining a pressure difference of 2.5 pa which can help in reducing the transmission of the virus from affected to not affected persons. ANSI/ASHRAE/ASHE Standard 170–2008 recommendations are followed for hospital applications, to facilitate effective ventilation. These negative pressure rooms prevent the spread of the contaminated particles to the surroundings and by creating a negative pressure in the room whenever the door is opened the atmospheric air is sucked in and not the one which is present inside the room. The Computational fluid dynamics simulations are performed to investigate the diffusion of airbone virus inside a negative pressure room with mixed mode ventilation system. It was identified that the mixed mode ventilation system is more effective in controlling the spread of virus droplets inside the room
Key words: COVID-19 / CFD simulation / negative pressure / isolation room / virus diffusion
© C. Anuraghava et al., Published by EDP Sciences, 2021
 This is an Open Access article distributed under the terms of the Creative Commons Attribution License (https://creativecommons.org/licenses/by/4.0), which permits unrestricted use, distribution, and reproduction in any medium, provided the original work is properly cited.
1 Introduction
Many hospitals use Isolation rooms for treating patients suffering from various diseases like TB, SARS, and the current COVID-19. When an infected person sneezes or coughs all those tiny particles are spread across the surroundings and when these particles are inhaled by the other person, he might be infected. All these rooms are negative pressure rooms such that those tiny particles don't spread across those rooms to the surroundings and are moved out of exhaust through HEPA filters. Computational fluid dynamics (CFD) plays an important role in designing these kinds of rooms by using different boundary conditions and choosing the different locations of the vents for getting accurate results. The current scenario suggests that COVID-19 spreads rapidly from person to person through direct or indirect contact with contaminated surfaces. we need to maintain social distancing to avoid the spread. Usually, people who are in close contact i.e. within a 1.5-m range with an infected person can catch the COVID-19 when the droplets get into the mouth or nose. The important measures and precautions to be taken by wearing the Mask, cleaning hands frequently. As there is an aerosol transmission the person who treats the covid patients (health care workers) must be taking at most care and by this research, we hope that we can bring a small change in the negative pressure room to avoid the spread of the particles into the room. To this, we have designed a negative pressure room such that the air entered the room directly reaches the patient and leaves through an exhaust duct placed behind the patient. As we all know air naturally flows from a high-pressure area to low-pressure areas by apply and directly hits the patient's chest and then leave through the exhaust by collecting the contaminated particles without spreading into the room and then the exhaust air is sent through the HEPA filters into the atmosphere so, that nearly 96% of the particles are trapped. This mixed-mode ventilation is very helpful for the health care workers and this model is very flexible as it does not require much electricity the natural vent is placed in the wind direction and when the natural ventilation is not available then the size and number of exhaust fans can be increased to ensure the required ventilation rate and this should be checked before fixing the setup, however, this mixed-mode ventilation setup should be used with care and monitoring should be done at regular intervals to maintain the air quality. The problem is solved using Ansys Fluent 19.0 software and the governing equations are solved by using finite volume method. The pressure velocity decoupling is avoided using simple algorithm and the turbulence is modelled using K-epsilon turbulence model and the geometry is meshed using tetrahedral mesh. The flow of fluid is transient and the problem is investigated by analyzing the contours of pressure, wall shear, particle residence time.
Alhamid et al. [1] found that quality of air and preventing the entry of pathogens and bacteria should be considered while designing a negative pressure isolation room. Here air filter plays a key role in the room. The existing design of FlowVent 8.2 is used in the airflow modeling, the new design of the vent is compared with the existing design and they observed that the velocity of airflow in the existing model is very high and it didn't meet the required standards. The new design is observed to be compatible and it has met the standards and the flow is observed to be laminar. Weihong Guo et al. [2] identified that natural ventilation is very important in terms of conservation of energy and explained how important is CFD in the simulation of wind with different designs and mathematical equations that help the architectures to review their designs accurately, in the paper they showed the methodology and optimization of the natural ventilation in a building using the CFD by considering three aspects like Building Shape, building envelope and site planning. Shelly et al. [3] have created and negative pressure isolation ward with 30 bed capacity with varying ventilation system and it has been very effective during an outbreak of the virus. The flow has been characterizedthroughout the room the pressure difference is observed constantly in a different location inside the ward. They have observed that the room is sightly becoming neutral or positively pressurized when the staff enters the room, this design has become effective in increasing the capacity in the hospital.
Prasad Mahajan et al. [4] described the importance and use of the negative pressure room and how CFD is used to simulate the flow inside a room. The isolation room is designed in solid works software and simulated using ANSYS fluent with Finite volume approach with blocking methodology using ICEM CFD. The analysis is done in a steady-state and results are observed around the patient by plotting the contours of pressure, velocity, and temperature. Tsao et al. [5] explained the location and size of doorway sizesare very important when compared to the air duct and exhaust air outlet. This analysis is done withdifferent room sizes and with different air changes per hour (ACH). It is observed that by increasing the doorway size the negative pressure decreases and may even decrease to zero when it is too large. Different sizes of the doorway and the ACH are clearly tabulated for the future use of the negative pressure room. Jinkyun Cho [6] explained the airflow path and airborne pollutant distribution has been examined by computational fluid dynamics modeling. The spread of the airborne contamination was analyzed in three different locations of the supply air diffuser and exhaust air diffuser in the Negative Pressure rooms and the results show that the ventilation system located in the low level is highly effective in removing airborne pollutants in the Isolation room.
Jeng-Min [7] explained a flow model of incompressible turbulent flow including buoyancy effect is used to study controlling the concentration of pollutants in isolated rooms to prevent airborne infection by changing the locations of air inlet/outlet and air change rate. Results Show that inlet placed above the foot end of bed and outlet placed on side of the wall are found to be highly effective. Cheong et al. [8] explained airflow and pollutant distribution patterns in an isolation room are studied by usingcomputational fluid dynamics (CFD) modeling based on three ventilation strategies. Each strategy uses different locations of air outlets and results show that outlets in the low-level locations had better pollutant removal efficiency. Kao et al. [9] created a cough model was constructed and a study is done on how virus diffusion and airflow behavior occur for various ventilation arrangements in a negative pressure room, also analysis was done on the region of droplet fallout and the dilution time of virus diffusion of coughed gas in the isolation. The results obtained states that parallel directional airflow pattern is the most effective means of controlling flows containing virus droplets. Tang et al. [10] studied with different types of doors used in negative pressure rooms and how they impact airflow. There are also numerous experimental [11–13] and analytical models [14–16] developed to estimate the mass flow rates of bidirectional air exchanges in open enclosures [17–20] and rooms. Different types of doors were used namely Single hinged, Double hinged, Single slide, and double slide doors where examined and the results show that Double hinged doors have a high risk of leakage into or out of the room and sliding doors have better efficiency in maintaining the flow in required rate. The numerical model is based on the Discreet phase. The particles are injected from the mouth through surface type injection.
2 Numerical methodology
Computational Fluid Dynamics has been playing a key role in the industries especially for the flow in and flow around a solid. In CFD any simulation is done through the Reynolds Averaged Navier Stokes equation which is mainly used for the point correlation of the fluctuating velocities. A dual intake of air is sent into the room the inlet and outlet conditions are given to maintain a pressure difference of 2.5 Pa. The numerical model is based on the Discreet phase. The particles are injected from the mouth through surface type injection. The Governing equations used in this analysis are momentum and continuity equations are used as they follow the law of conservation. The estimated value of uncertainty in the present numerical simulation is close to 5%.
2.1 Geometrical considerations
For conducting an experiment on transient, pressure-based simulation we have created a room by using solid works with dimensions 20 ft × 9 ft × 9 ft where the entire room is divided into two parts with two beds the entire geometry has rectangular inlets and circular outlets each. The outlets are placed on the wall just right above the patient's head. The exhaust is then connected to the HEPA filters to purify the air. The inlet is a natural vent where it is placed in the wind direction and the air is directed into the room at a 45° angle such that it directly sweeps the patient chest. Meshing and simulation are done in the Ansys Fluent R 19.0. In Table 1 we can see the dimensions of the room and human body. The operating Boundary Conditions are set as a velocity inlet and pressure outlet with the Discrete Phase model where the particle injection is done. The walls are defined as a no-slip boundary condition. By creating a negative pressure inside a room where the cough droplets are directed towards the outlet without spreading into theroom. Figures 1 and 2 shows the different views of the geometric model.
Dimensions of model.
 |
Fig. 1 Isometric view of the model. |
 |
Fig. 2 Front view of the model. |
2.2 Meshing
For meshing the room ANSYS Workbench is used. The solver preference is selected as Fluent and the edge sizing is used separately for the room and the Patients bed, the element size is set to 0.01 m for the patient's bed and 0.1 m for the room. The element quality 0.99 and the skewness is 0.855. In Table 2 we can see the total number of nodes and elements and clear picture of the meshed model in Figure 3.
Mesh details.
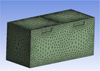 |
Fig. 3 Meshed model. |
3 Analysis
After the meshing, FLUENT is used for carrying out the analysis. The pressure-based solver is used under the transient state is applied. The Energy equation is ignored as the air inlet is entered at room temperature. Gravity is set to 9.81 m/s. The K-epsilon Turbulence model is used and the particle injection is done through the Discrete Phase Model and the Injection is type is given as a surface type of injection. Injection material is Water-liquid is used. In the turbulent dispersion type while setting the particle injection Discrete random walk model is used as the fluctuating velocity components are piecewise constant functions of time. The Boundary Conditions were given as Velocity inlet and Pressure outlet. The velocity of the inlet is taken as 3.8 m/s. The Turbulence is given as a default value for the Turbulent Intensity and Viscosity ratio. The Human outlet is designed at a thirty-degree angle to the velocity inlet which is of velocity 10 m/s.
Normally Discrete Phase Model (DPM) is used to study the behavior of particles from different types of views like the Lagrangian view and in a discrete perspective. The Injection of the particles is done in the discrete state and the setup in the DPM is set with a particle diameter of 3.1e-07 m and with an average human cough velocity of 10 m/s and the particles are tracked with the fluid flow time step which enables the use of fluid time steps to inject the particles here the end time is taken as 4 s. The Total flow rate comes out to be 9.9e-12 kg/s by calculating.
The DPM setup is set as Unsteady particle tracking with the particle time step size as 0.01 sec and Tracking parameters are left as default.
4 Results and discussions
The analysis is done in a negative pressure room considering the dimensions of two different human bodies. The flow patterns inside the room are investigated by plotting the streamlines. Figure 4 shows the particle distribution and air flow patterns inside the room. The recirculation patterns indicates that the diffusion of virus droplets into the surrounding ambient air. Figure 5 shows the pressure distribution of smaller dimension body. Figure 6 shows the walls shear contours in the dual chamber enclosure and it observed that the particle shear stress increases with increase in air flow rates. Figure 7a and b shows the motion of particles towards the circular exhaust opening and it is observed that the negative pressure room is effective in controlling the diffusion and spreading rate of virus droplets. Figures 8 and 9 shows the pressure and wall shear contours of the larger body dimensions. The results are observed to be effective in a negative pressure room sincethe particles are united and directed towards the outlet without spreading into the room in both the bodies of different dimensions and there is no much difference in the flow patterns. With the help of CFD Simulation we get accurate results. The velocity and pressure contours areconverging. The flow rate inside the room i.e., recirculation is very less inside the room and monitoring of temperature, pressure and flow rate is done by placing the sensors at different locations and this mixed-mode ventilation is very effective in controlling the virus spreading rate.
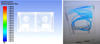 |
Fig. 4 Flow inside the room due to human emitted particles and airflow. |
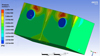 |
Fig. 5 Pressure contour_Human_Body_1. |
 |
Fig. 6 Wall Shear contour_Human_Body_1. |
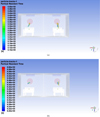 |
Fig. 7 (a) Particles directed towards the exhaust. (b) Particles directed towards the exhaust. |
 |
Fig. 8 Pressure contour _Human_Body_2. |
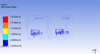 |
Fig. 9 Wall Shear contour_Human_Body_2. |
5 Conclusions
The virus diffusion characteristics in a negative pressure room are numerically analyzed by varying mixed mode ventilation flow rates inside a closed enclosure. The discrete particle simulation is performed to track the motion and diffusion of virus droplets and investigation is performed by analyzing the streamlines and pressure contours. The recirculation patterns indicates that the diffusion of virus droplets into the surrounding ambient air. The pressure distribution contours indicated an increased pressure near the circular vents. It was found from the walls shear contours that the particle shear stress increases with increase in air flow rates. The motion of particles towards the circular exhaust opening is observed and it was identified that the negative pressure room is effective in controlling the diffusion and spreading rate of virus droplets. The results from the present study will be useful in controlling the virus diffusion in a closed environment.
References
- J. Cho, Investigation on the contaminant distribution with improved ventilation system in hospital isolation rooms, Appl. Therm. Eng. 148, 208–218 (2019) [Google Scholar]
- S.L. Miller, N. Clements, S.A. Elliott, Implementing a negative pressure isolation ward for a surge in airborne infectious patients, Am. J. Infect. Control 45, 652–659 (2017) [Google Scholar]
- R. Harish, K. Venkatasubbaiah, Numerical investigation of instability patterns and nonlinear buoyant exchange flow between enclosures by variable density approach, Comput. Fluids 96, 276–287 (2014) [Google Scholar]
- P.H. Kao, R.J. Yang, Virus diffusion in isolation rooms, J. Hosp. Infect. 62, 338–345 (2005) [Google Scholar]
- J.-M. Huang, S.-M. Tsao, The Influence of air motion on bacteria removal in negative pressure isolation rooms, HVAC&R Res. 11, 563–585 (2005) [Google Scholar]
- R. Harish, K. Venkatasubbaiah, Effects of buoyancy induced roof ventilation systems for smoke removal in tunnel fires, Tunn. Undergr. Space Technol. 42, 195–205 (2014) [Google Scholar]
- Y.-H. Tsai, G.-H. Wan, Y.-K. Wu, K.-C. Tsao, Airborne severe acute respiratory syndrome coronavirus concentrations in a negative- pressure isolation room, Inspect. Control Hosp. Epidemiol. 27, 523–525 (2006) [Google Scholar]
- K. Khankari, Patient room HVAC, Am. Soc. Heat. Refrig. Air Cond. Eng. J. 58, 16–26 (2016) [Google Scholar]
- M. Idrus Alhamid, Budihardjo, A. Raymond, Design of the ventilation system and the simulation of air flow in the negative isolation room using FloVent 8.2, AIP Conf. Proc. 1984, 020016 (2018) [Google Scholar]
- R. Harish, K. Venkatasubbaiah, Mathematical modeling and computation of fire induced turbulent flow in partial enclosures, Appl. Math. Model. 37, 9732–9746 (2013) [Google Scholar]
- W. Guo, X. Liu, X. Yuan, Study on natural ventilation design optimization based on CFDsimulation for green buildings, Procedia Eng. 121, 573–581 (2015) [Google Scholar]
- R. Harish, K. Venkatasubbaiah, Large Eddy Simulation of thermal plume behavior in horizontally partitioned dual enclosure, Build. Simul. 8, 137–148 (2014) [Google Scholar]
- P. Mahajan, S. Arun Saco, R. Dinesh Kumar, R. Thundil Karuppa Raj, Airflow simulation of an isolationroom using CFD technique, Int. J. Pure Appl. Math. 118, 4261–4269 (2018) [Google Scholar]
- K.W.D. Cheong, S.Y. Phua, Development of ventilation design strategy for effective removal of pollutants in the isolation room of a hospital, Build. Environ. 41, 1161–1170 (2006) [Google Scholar]
- R. Harish, K. Venkatasubbaiah, Transport phenomena of turbulent fire spread through compartment connected to vertical shaft in tall building, Fire Saf. J. 61, 160–174 (2013) [Google Scholar]
- S. Al-Benna, Negative pressure rooms and COVID-19, J. Perioper. Pract. 3, 18–23 (2020) [Google Scholar]
- N. Pavelchak, R.P. DePersis, M. London, R. Stricof, M. Oxtoby, G. DiFerdinando, E. Marshall, Identification of factors that disrupt negative air pressurization of respiratory isolation rooms, Infect. Control Hosp. Epidemiol. 21, 191–195 (2000) [Google Scholar]
- T.T. Chow, A. Kwan, Z. Lin, W. Bai, Conversion of operating theatre from positive to negative pressure environment, J. Hosp. Infect. 64, 371–378 (2006) [Google Scholar]
- T.T. Chow, X.Y. Yang, Ventilation performance in operating theatres against airborne infection: review of research activities and practical guidelines, J. Hosp. Infect. 56, 85–92 (2004) [Google Scholar]
- Y.-C. Tung, Y.-C. Shih, S.-C. Hu, Numerical study on the dispersion of airborne contaminants form an isolation room in the case of door opening, Appl. Therm. Eng. 29, 1544–1551 (2009) [Google Scholar]
Cite this article as: Chakka Anuraghava, Koppaka Abhiram, Vengalathur Naveen Sai Reddy, Harish Rajan, CFD modelling of airborne virus diffusion characteristics in a negative pressure room with mixed mode ventilation, Int. J. Simul. Multidisci. Des. Optim. 12, 1 (2021)
All Tables
All Figures
|
Fig. 1 Isometric view of the model. |
| In the text | |
|
Fig. 2 Front view of the model. |
| In the text | |
|
Fig. 3 Meshed model. |
| In the text | |
|
Fig. 4 Flow inside the room due to human emitted particles and airflow. |
| In the text | |
|
Fig. 5 Pressure contour_Human_Body_1. |
| In the text | |
|
Fig. 6 Wall Shear contour_Human_Body_1. |
| In the text | |
|
Fig. 7 (a) Particles directed towards the exhaust. (b) Particles directed towards the exhaust. |
| In the text | |
|
Fig. 8 Pressure contour _Human_Body_2. |
| In the text | |
|
Fig. 9 Wall Shear contour_Human_Body_2. |
| In the text | |
Current usage metrics show cumulative count of Article Views (full-text article views including HTML views, PDF and ePub downloads, according to the available data) and Abstracts Views on Vision4Press platform.
Data correspond to usage on the plateform after 2015. The current usage metrics is available 48-96 hours after online publication and is updated daily on week days.
Initial download of the metrics may take a while.