")
")
| Issue |
Int. J. Simul. Multidisci. Des. Optim.
Volume 10, 2019
|
|
|---|---|---|
| Article Number | A9 | |
| Number of page(s) | 7 | |
| DOI | https://doi.org/10.1051/smdo/2019011 | |
| Published online | 10 June 2019 | |
Research Article
Thermal mechanical characterization of copolyester for additive manufacturing using FDM
1
INRA, UR1268 Biopolymères Interactions Assemblages, 44300 Nantes, France
2
ENSEM, Laboratory of Control and Mechanical Characterization of Materials and Structures, University Hassan II Casablanca, Casablanca, Morocco
3
LUNAM Université Nantes Angers Le Mans, CNRS, GEPEA, UMR 6144, IUT de Nantes, avenue du Professeur Jean Rouxel, 44475 Carquefou Cédex, France
4
CMLA, ENS Cachan, CNRS, Université Paris-Saclay, 94235 Cachan, France
5
UBFC, UTBM, Rue du Chateau, 90010 Belfort Cedex, France
* e-mail: This email address is being protected from spambots. You need JavaScript enabled to view it.
Received:
9
February
2019
Accepted:
17
May
2019
Abstract
The main purpose of this study is to highlight the thermal and mechanical characterization of printed copolyester-based polymer. The variety of benefits of this material, such as its food contact compliance and important mechanical properties, have proved to be effective in huge field of applications, including medical sector and packaging uses. However, it has not received much attention for 3D printing processes. As the printing temperature is a key parameter of fused deposition modeling (FDM) process, the present study is started by analyzing its effect on the mechanical properties of printed copolyester under tensile loading. Indeed, the determination of temperature optimal values to print this material with FDM process is done based on tensile properties, including tensile strength, Young's modulus, ultimate tensile and yield strength, ductility and fracture toughness. The fracture properties of printed copolyester are also discussed using “scanning electron microscopy” (SEM). The results indicate a strong effect of the extrusion temperature on tensile properties. In addition, the analysis of copolyester sample microstructure reveals several damage mechanisms within the printed parts that reflect different types of wires fracture form subjected to the same tensile loading.
Key words: Fused deposition modelling / copolyester / tensile properties / fracture toughness
© K. Abouzaid et al., published by EDP Sciences, 2019
 This is an Open Access article distributed under the terms of the Creative Commons Attribution License (http://creativecommons.org/licenses/by/4.0), which permits unrestricted use, distribution, and reproduction in any medium, provided the original work is properly cited.
1 Introduction
Fused deposition modeling (FDM) is one of the most used additive manufacturing processes, which can produce almost any complex parts with near zero material waste that leads to classifying it among the economic processes. Moreover, this process is considered to be more environment-friendly, according to latest ecological standards [1], especially, since the use of the biobased materials. The development of this combination is innovative. It is not only to reduce the cost of production, but also to get material that possess excellent tensile properties compared to PLA and ABS materials [2–9]. These two previous materials have received much attention over the last years due to the important mechanical properties and their suitability to the application that is present. That is the reason why, nowadays, almost all studies are deviated to characterize different biobased materials, thanks to its environment-friendly behavior, in order to optimize the FDM printing setting to show the influence of printing parameters on mechanical properties [10–14].
In fact, to enlarge the feedstock material offer for FDM, several research groups investigated the printing feasibility of materials dedicated to injection molding. Among the slightly affected materials by FDM process, polyethylene terephthalate glycol (PETG) [13,15] and polypropylen (PP) [16–19] offer good strength (53 and 36 MPa, respectively); even after printing the ultimate tensile strength becomes around 40 and 35 MPa, respectively. Printability of more flexible materials like nylon on polyamide (PA) was achieved in [20,21] using a large extrusion temperature range of 235–260 °C. The authors show linear effect of the extrusion temperature on the adhesion of nylon on PA. The use of composites to enhance the properties of printed part is one of the up-to-date topics. In their contributions, Szykiedans et al. [13] and Carneiro et al. [16] showed that adding glass fibers to PETG and PP lead to increase in Young's Modulus from 400 to 1436 MPa and from 1300 to 1400 MPa, respectively.
However, the analysis of the literature works showed a lack of experimental studies about the printability of copolyester, which has not been adequately regarded.
The present study treats the printability of copolyester in order to give the adequate temperature printing range to achieve a successful outcome. Moreover, the mechanical characterization of this material is investigated by varying an important parameter that is the extrusion temperature to show its impact on the adhesion of layers and the tensile strength as well as the fracture toughness of the printed samples.
2 Experimental layout
The feedstock material used in this study was copolyester-based polymer, which is provided in wires form of 1.75 mm in diameter. Specimens are manufactured using MakerBot© replicator 2 3D printer equipment with an extruder of 0.4 mm in diameter. Printing parameters used in this study are presented in Table 1, which take six different values: 230, 235, 240, 245, 250 and 255 °C.
To reveal the temperature distribution of the deposit, almost melting copolyester during the process, an infra-red (IR) camera (Flir A35 series), with 320 × 256 pixels as resolution, was used. The analysis of the given temperature results was done by a flir tool software. This camera was deposited at 10 cm from printing table.
ISO 527-1/-2 standards [22] are followed to manufacture the FDM dog-bone specimens to perform tensile test (Fig. 1). To obtain the mechanical properties of these materials, the investigation of uniaxial test using Zwick Roell testing machine with a load capacity of 10 kN is done. In addition, the toughness of the printed samples is determinate by testing notched parts with 2 mm of notch size. The tensile loading is based on a displacement control with a constant rate of 5 mm/min and the relationship between force (N) and displacement (mm) were collected by computer with help of testXpertII data acquisition software.
To follow the specimen deformation under testing, an optical system composed of a high-speed camera (Phantom V7.3 from Photonline, Marly Le Roi, 78-France) with varied frame rate between 10 fps (frame per second) and 10 000 fps was investigated.
The fracture surfaces of the specimens were also observed using a JEOL JSM 7600F Scanning Electron Microscope (SEM) under different magnifications reaching 95× with an interval of pixel size between 1 and 2.78 μm. Before SEM observations, the target surfaces were metalized by coating them by an ultrathin layer of gold/palladium.
In order to study the measurements of the apparent density, X-ray micro-tomography was used to obtain the porosity of printed copolyester. 3D imaging was based on UltraTom X-ray micro-CT equipment with the following acquisition parameters: 230 KV X-ray source, voltage = 80 KV, current intensity = 480 μA, number of radiographic images = 1440, detector resolution = 1920 × 1536 pixels, voxel size = 14.31 μm, acquisition duration = 20 min. The total number of voxels of the tomogram was 0.46 billion voxels. The imaged sample had the following dimensions 434 × 825 × 1277 voxels corresponding to the physical dimensions 6 × 12 × 18 mm3. The overall X-ray micro-tomography analysis of the sample printed at the three printing temperatures allowed to obtain 1440 images (per sample), which have undergone numerical treatment to isolate the different part of every image, including porosity, background, and copolyester phase using ImageJ free software, to extract the content of porosity.
Printing setting parameters.
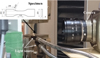 |
Fig. 1 Tensile test equipment and dog-bone specimen dimensions. |
3 Results and discussion
Figure 2 shows the result of the tensile test performed on a provided copolyester filament from supplier and the related tensile properties are summarized in Table 2.
From the tensile response, it is clearly evident that copolyester wire has ductile behavior while some of mechanical properties are lower than those of the literature, such as Young modulus and ultimate tensile strength. Moreover, the stress–strain curve can be decomposed to four different sections:
-
Section A–B: from the test start until the achievement of the maximum stress, it presents a linear part that describes the elastic and the beginning of the plastic deformation;
-
Section B–C: beyond the maximum tensile strength, a sudden loss is observed at the same deformation value. Noteworthy, this sharp drop is caused by the decrease of the filament section due to the necking phenomenon that is proved by the optical image of Figure 3,
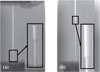
Fig. 3 Necking phenomenon of tested filament. (a) End of Section A–B. (b) End of Section B–C.
-
Section C–D: another increase of stress is noted due to the hardening of the polymer material before reaching the viscoplastic plateau at which the stress was stabilized.
The extracted mechanical properties show that both ABS and PLA filaments are stiffer comparatively to the copolyester where its Young's modulus are 1.8 and 3 GPa, respectively [4,23,24]. Moreover, the ultimate tensile strength of the filament is up to approximately 50 MPa. Thus, the studied copolyester is tough as PLA filament [4,25] but much tougher than the widely used ABS filament whose ultimate tensile strength is around 40 MPa [3,23,26].
Prior to processing the printing operation, an analysis of thermal behavior is primordial to fix the operable printing temperature range, thus, a follow-up on thermal changes of the neat copolyester is done using DSC analysis. The temperature range used in this study is between −40 and 300 °C with 10 °C/min of heating rate. This temperature interval is fixed with respect to the recommended. The glass transition obtained by this analysis is 79 °C, which verify the condition given by the follow expression.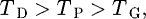 (1)where T
D is the thermal degradation temperature of the polymer, T
P and T
G are the printing and glass temperatures, respectively.
(1)where T
D is the thermal degradation temperature of the polymer, T
P and T
G are the printing and glass temperatures, respectively.
After making sure that the printing temperature range taken into account in this study satisfies the expression (1). Another thermal analysis is investigated using IR camera to follow the heating of the raster just extruded from the extrusion nozzles. Figure 4 presents the thermal distribution of copolyester raster during printing process for all printing temperatures. It is apparent that printed rasters are significantly continuous for larger printing temperatures that lead to ensure more cohesive parts.
The temperature profile of the raster during the laying down process for the six different printing temperatures gives as a results, a fluctuation curve characterized by a peak and ground temperature, as summarized in Table 3.
The difference between the ground and the peak temperatures during the deposit of raster (ΔT) shows that above 240 °C, the difference is more significant and increases with the increasing of the printing temperature, while, it is almost stable below 240 °C. By merging the observations from Figure 4 and Table 3, we can conclude that the higher difference between the ground and the peak temperatures present a criterion to obtain a continuity and better adhesion between rasters.
Based on the previous results, the printing temperature range is limited to 240, 250 and 255 °C. It should be noted that all attempts to print specimens with extrusion temperature below 240 °C were failed.
Before testing the printed specimens, the analysis of the sample microstructure with X-ray micro-tomography image was investigated, with the aim of getting a specific idea of the three-dimensional arrangement of the porosity. In this context, Figure 5 presents the porosity content of the samples just after printing.
The porosity content improves by increasing the printing temperature. The difference between the porosity percentages of the sample printed with 240 and 255 °C is around 12%, which is large compared to the remaining temperatures. This evident decrease proves that 240 °C is the contrast printing temperature value.
This porosity percentage is accompanied by a close look at the printed samples for the three printing temperature conditions; it is clearly shown that the cohesion inter-filaments are affected by the extrusion temperature. Increasing the printing temperature from 240 to 255 °C leads to a far pronounced cohesion inter-filament. Thus, printing with the highest temperature secures the best visual rending.
Typical tensile strain–stress curves of neat specimens of printed copolyester using different temperature are illustrated in Figure 6.
The effect of the printing temperature on the tensile response is clearly visible. A considerable improvement of mechanical properties is mentioned with the increase of extrusion temperature from 240 until 250 °C. Hence, this enhancement percentage is not reached below 250 °C.
By comparing the curve form of these tensile printed specimens with the tensile wire, it is noted that they do not adopt the same form. The three curves of printed specimens follow a little deformation, which can be decomposes in three parts. The elastic deformation can be considering as a first part, followed by a low plastic deformation. Then, the third part presents a non-linear decrease of stress accompanied by an increase of specimen deformation until the fracture is achieved.
Table 4 gives a summary of the tensile properties obtained by testing specimens of copolyester printed at different extrusion temperature, including Young's modulus, yield stress, tensile strength, strain and stress rupture.
The influence of the printing temperature on copolyester tensile properties is mentioned just in the improvement of stiffness, strength, and yield strength. However, the other properties, including stress and strain at break, are not affected.
The falling of the copolyester performance due to the influence of FDM process, comparing to the filament tensile properties, is on the order of 76, 51, and 63% for Young's module, yield strength, and maximum tensile strength, respectively, by printing with 240 °C. While it is reduced by a percentage of 61, 22, and 37%, respectively, using the highest temperature.
Tensile of notched copolyester specimens is also carried out to follow the crack propagation of printed samples. Figure 7 shows the copolyester-notched specimen before and after fracture.
The crack path follows the raster orientation, which is fixed at 45°, until reaching the sample perimeters. Nevertheless, the perimeter crack keeps the same orientation of the notch, which is orthogonal to the direction of loading applied. These perimeters are printed following 0° as raster orientation. Accordingly, the crack always follows the raster orientation with which the sample is printed. This crack propagation is connected with the weakest points presented by the intersection of the rasters, which are damaged by the necking phenomenon.
With regard to the fracture toughness study, the impact of printing temperature on toughness of copolyester extracted from notched specimen tested, which are manufactured by the same extrusion temperatures, are calculated by the following formula: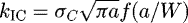 (2)
(2)
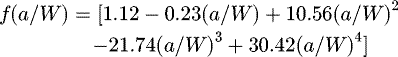 (3)where a is the notch length, W is specimen width, σ
C is critical stress and f(a/W) is geometry formula.
(3)where a is the notch length, W is specimen width, σ
C is critical stress and f(a/W) is geometry formula.
The fracture toughness values resulted is between 1.19 and 1.51 MPa.m1/2. This range is almost similar to the ones of PLA and ABS materials [23,28–31]. An evident enhancement of the fracture toughness values obtained, around 27%, is marked due to the effect of printing temperature by increasing it from 240 to 255 °C.
Furthermore, the mechanisms of damage after rupture of sample printed with 255 °C is explored by scanning electron microscope by observations and presented in Figure 8.
The apparent voids between rasters in Figure 8a are not related to the porosity resulting from the FDM process, they are due to the significant stretching of the part under the effect of the tensile force.
Moreover, an inhomogeneous deformation of the rasters after application of the tensile force is noticed and presented by the shrinkage of the filaments close to the rupture zone, inducing the loss of inter-filament compactness. Deformation at some rasters is also observed, causing its deviation from the initial form. These various damages are explained by the location of the force applied at these deformed areas (Fig. 8a).
Besides, ductile behavior and crack propagation stability of the copolyester is noted and proved by the roughness of the fracture surfaces, at each individual filament. Another form of damage is shown in this area. Two fracture modes, following the same type of uni-axial stress, are distinguished. The first type is presented by mode I at the shrink filaments that kept their direction perpendicular to the direction of force application (Fig. 8b). The second form of fracture surface exposed on SEM observations is in the form of tearing of some filaments leaving behind a complex damage (Fig. 8b).
Another phenomenon of incomplete failure is shown in Figure 8c at the sample perimeters. The latter kept their forms without breaking. We can explain this phenomenon by the fact that the damage of the majority of centered rasters has capped the maximum stress applied to a value lower than that, which can bear those perimeters that suffered a slight damage translated by a simple elongation.
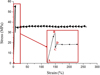 |
Fig. 2 Stress–strain curve obtained by filament tensile testing. |
Tensile properties of copolyester filament.
Peak and ground temperatures extract of IR recording.
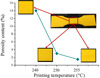 |
Fig. 5 Porosity content of copolyester printed specimens. |
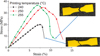 |
Fig. 6 Stress–strain curve obtained by samples' tensile testing. |
Tensile properties of copolyester samples.
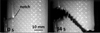 |
Fig. 7 High sped recording of the fracture pattern in copolyester-notched specimen. |
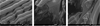 |
Fig. 8 SEM image of tensile fracture surface of copolyester specimen printed at 255 °C. |
4 Conclusions
The printability of copolyester is ensured by using less than 240 °C printing temperature. Respecting this temperature range leads avoiding all printing damages, such as low adhesion and cohesiveness between rasters and layers. Printing with 255 °C has proved to offer high mechanical quality with the enhancement of tensile properties, including Young's modulus, and ultimate tensile strength compared to the other temperatures. The fracture toughness is also affected by printing temperature which has the same improvement trend as tensile properties. The observations of surface fracture reveal the presence of multiple damage mechanisms during the tensile test that allows the rupturing, such as inhomogeneous deformation within the printed part, necking phenomenon, and the observation of different modes of failure.
References
- ISO/ASTM WD 5293 2, Additive manufacturing − Environmental health and safety − Standard test method for determination of particle emission rates from desktop 3D printers using material extrusion, 2012 [Google Scholar]
- A.a. Alafaghani, et al., Experimental optimization of fused deposition modelling processing parameters: a design-for-manufacturing approach Procedia Manuf. 10 (Supplement C), 791–803 (2017) [CrossRef] [Google Scholar]
- B. Anna, Selçuk, Mechanical characterization of parts fabricated using fused deposition modeling, Rapid Prototyp. J. 9 , 252–264 (2003) [CrossRef] [Google Scholar]
- C. Casavola et al., Orthotropic mechanical properties of fused deposition modelling parts described by classical laminate theory, Mater. Des. 90 , 453–458 (2016) [CrossRef] [Google Scholar]
- S. Bakrani Balani et al., Influence of printing parameters on the stability of deposited beads in fused filament fabrication of poly(lactic) acid, Addit. Manuf. 25, 112–121 (2019) [CrossRef] [Google Scholar]
- D. Popescu et al., FDM process parameters influence over the mechanical properties of polymer specimens: a review, Polym. Test. 69 , 157–166 (2018) [Google Scholar]
- H. Li et al., The effect of process parameters in fused deposition modelling on bonding degree and mechanical properties, Rapid Prototyp. J. 24 , 80–92 (2018) [CrossRef] [Google Scholar]
- K. Li et al., Study on the mechanical performance optimization of fdm built parts, in: Applied Sciences in Graphic Communication and Packaging , Springer, Berlin, 2018, pp. 563–569 [CrossRef] [Google Scholar]
- J.R.C. Dizon et al., Mechanical characterization of 3D-printed polymers, Addit. Manuf. 20 , 44–67 (2018) [CrossRef] [Google Scholar]
- A. Le Duigou et al., 3D printing of wood fibre biocomposites: From mechanical to actuation functionality, Mater. Des. 96, 106–114 (2016) [CrossRef] [Google Scholar]
- A. Shahzad, A study in physical and mechanical properties of hemp fibres, Adv. Mater. Sci. Eng. 2013 (2013) [CrossRef] [Google Scholar]
- H. Peltola et al., Wood based PLA and PP composites: effect of fibre type and matrix polymer on fibre morphology, dispersion and composite properties, Compos. Part A Appl. Sci. Manuf. 61 , 13–22 (2014) [CrossRef] [Google Scholar]
- K. Szykiedans, W. Credo, D. Osiński, Selected mechanical properties of PETG 3-D prints, Procedia Eng. 177 , 455–461 (2017) [CrossRef] [Google Scholar]
- J. Avila, S. Bose, A. Bandyopadhyay, Additive manufacturing of titanium and titanium alloys for biomedical applications, in Titanium in Medical and Dental Applications, Elsevier, Cambridge, 2018, pp. 325–343 [CrossRef] [Google Scholar]
- N.E. Zander, M. Gillan, R.H. Lambeth, Recycled polyethylene terephthalate as a new FFF feedstock material, Addit. Manuf. 21 , 174–182 (2018) [CrossRef] [Google Scholar]
- O. Carneiro, A. Silva, R. Gomes, Fused deposition modeling with polypropylene, Mater. Des. 83 , 768–776 (2015) [Google Scholar]
- D. Stoof, K. Pickering, Sustainable composite fused deposition modelling filament using recycled pre-consumer polypropylene, Compos. Part B Eng. 135 , 110–118 (2017) [CrossRef] [Google Scholar]
- M. Milosevic, D. Stoof, K. Pickering, Characterizing the mechanical properties of fused deposition modelling natural fiber recycled polypropylene composites, J. Compos. Sci. 1 , 7 (2017) [CrossRef] [Google Scholar]
- L. Wang, D.J. Gardner, Effect of fused layer modeling (FLM) processing parameters on impact strength of cellular polypropylene, Polymer, 113 , 74–80 (2017) [CrossRef] [Google Scholar]
- R.H. Sanatgar, C. Campagne, V. Nierstrasz, Investigation of the adhesion properties of direct 3D printing of polymers and nanocomposites on textiles: effect of FDM printing process parameters, Appl. Surf. Sci. 403 , 551–563 (2017) [Google Scholar]
- S. Aslanzadeh et al., Investigation on electrical and mechanical properties of 3D printed nylon 6 for RF/microwave electronics applications, Addit. Manuf. 21 , 69–75 (2018) [CrossRef] [Google Scholar]
- ISO and ASTM International Unveil Framework for Creating Global Additive Manufacturing Standards, MENA Report, Albawaba (London) Ltd., 2016 [Google Scholar]
- N. Aliheidari et al., Fracture resistance measurement of fused deposition modeling 3D printed polymers, Polym. Test. 60 , 94–101 (2017) [CrossRef] [Google Scholar]
- J. Chacón et al., Additive manufacturing of PLA structures using fused deposition modelling: effect of process parameters on mechanical properties and their optimal selection, Mater. Des. 124 , 143–157 (2017) [CrossRef] [Google Scholar]
- B. Wittbrodt, J.M. Pearce, The effects of PLA color on material properties of 3-D printed components, Addit. Manuf. 8 , 110–116 (2015) [CrossRef] [Google Scholar]
- R.T.L. Ferreira et al., Experimental characterization and micrography of 3D printed PLA and PLA reinforced with short carbon fibers, Compos. Part B Eng. 124 , 88–100 (2017) [Google Scholar]
- K. Abouzaid, S. Guessasma, S. Belhabib, D. Bassir, A. Chouaf, Printability of co-polyester using fused deposition modelling and related mechanical performance, Eur. Polym. J. 108 , 262–273 (2018) [CrossRef] [Google Scholar]
- N. Aliheidari et al., Measuring the interlayer fracture resistance of FDM printed thermoplastics, presented at Society of Plastics Engineers, Annual Technical Conference SPE-ANTEC, At Indianapolis, Indiana, 2016 [Google Scholar]
- T.D. McLouth et al., The impact of print orientation and raster pattern on fracture toughness in additively manufactured ABS, Addit. Manuf. 18 , 103–109 (2017) [CrossRef] [Google Scholar]
- J. Torres et al., An approach for mechanical property optimization of fused deposition modeling with polylactic acid via design of experiments, Rapid Prototyp. J. 22 , 387–404 (2016) [CrossRef] [Google Scholar]
- K.R. Hart, E.D. Wetzel, Fracture behavior of additively manufactured acrylonitrile butadiene styrene (ABS) materials, Eng. Fract. Mech. 177 , 1–13 (2017) [CrossRef] [Google Scholar]
Cite this article as: Khaoula Abouzaid, Sofiane Guessasma, Sofiane Belhabib, David Bassir, Abdelkrim Chouaf, Thermal mechanical characterization of copolyester for additive manufacturing using FDM, Int. J. Simul. Multidisci. Des. Optim. 10, A9 (2019)
All Tables
All Figures
|
Fig. 1 Tensile test equipment and dog-bone specimen dimensions. |
| In the text | |
|
Fig. 2 Stress–strain curve obtained by filament tensile testing. |
| In the text | |
|
Fig. 3 Necking phenomenon of tested filament. (a) End of Section A–B. (b) End of Section B–C. |
| In the text | |
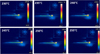 |
Fig. 4 IR recording thermal analysis of the raster during the laying down process [27]. |
| In the text | |
|
Fig. 5 Porosity content of copolyester printed specimens. |
| In the text | |
|
Fig. 6 Stress–strain curve obtained by samples' tensile testing. |
| In the text | |
|
Fig. 7 High sped recording of the fracture pattern in copolyester-notched specimen. |
| In the text | |
|
Fig. 8 SEM image of tensile fracture surface of copolyester specimen printed at 255 °C. |
| In the text | |
Current usage metrics show cumulative count of Article Views (full-text article views including HTML views, PDF and ePub downloads, according to the available data) and Abstracts Views on Vision4Press platform.
Data correspond to usage on the plateform after 2015. The current usage metrics is available 48-96 hours after online publication and is updated daily on week days.
Initial download of the metrics may take a while.