")
")
| Issue |
Int. J. Simul. Multidisci. Des. Optim.
Volume 16, 2025
Multi-modal Information Learning and Analytics on Cross-Media Data Integration
|
|
|---|---|---|
| Article Number | 15 | |
| Number of page(s) | 16 | |
| DOI | https://doi.org/10.1051/smdo/2025017 | |
| Published online | 03 October 2025 | |
Research Article
Perception and sharing optimization mechanism of digital media art interactive device driven by adaptive AI
Engineering Training Center, Taiyuan University, Taiyuan, 030032 Shanxi, China
* e-mail: This email address is being protected from spambots. You need JavaScript enabled to view it.
Received:
13
June
2025
Accepted:
18
August
2025
Abstract
Current digital media art interactive devices are difficult to adapt to complex environments due to fixed perception mechanisms, and are easily affected by noise interference and low light, resulting in reduced recognition accuracy and interaction delay, affecting the immersive experience. This study constructs a perception and sharing optimization mechanism for digital media art interactive devices driven by adaptive Artificial Intelligence (AI). A multi-channel data fusion perception network is proposed, and the Transformer encoder is used to fuse Red-Green-Blue (RGB) image, infrared depth map, and speech spectrum map features to improve perception robustness. A user behavior temporal modeling module based on Bidirectional Graph Recurrent Transformer (Bi-GRT) is designed to achieve dynamic recognition of continuous actions, gestures, and speech emotions. Environmental simulation and adaptive control mechanisms are applied, and reinforcement learning is combined to dynamically adjust sensor parameters to adapt to environmental changes. A multi-user interactive sharing framework is constructed through federated learning to ensure privacy while improving model consistency. Finally, a real-time feedback optimization and content rendering collaborative engine is developed to achieve dynamic scheduling and optimization of multi-dimensional output content based on Graph Attention Network (Bi-GRT). Experiments show that the system has an accuracy rate of over 80% in multi-action sample recognition; the environmental adaptability achieves a response delay of 210 ms in a noisy environment; the sequence similarity of each terminal in federated learning is above 0.91; the user immersion peak is 9.2 points, Compared with existing systems, this framework has achieved breakthrough progress in environmental adaptability, multi-user collaboration, and privacy protection, providing a quantifiable performance improvement path for digital media art interactive devices.
Key words: Digital media art interaction / adaptive artificial intelligence / multimodal data fusion / federated learning / graph neural networks
© C. Liu, Published by EDP Sciences, 2025
 This is an Open Access article distributed under the terms of the Creative Commons Attribution License (https://creativecommons.org/licenses/by/4.0), which permits unrestricted use, distribution, and reproduction in any medium, provided the original work is properly cited.
1 Introduction
Currently, digital media art, as a product of interdisciplinary integration, is widely used in exhibitions, public space installations, and educational communication. As its core carrier, interactive installations rely on multimodal perception and real-time feedback mechanisms to achieve a human-computer interaction experience [1–3]. Digital media art interactive installations continue to develop in the dimensions of perception and interaction, allowing the audience to play the role of information input source in space. However, existing systems mostly rely on fixed-structure cameras, infrared sensors, and sound acquisition devices to build interactive channels. Their perception and feedback capabilities are limited by preset algorithms and static parameter regulation, and are difficult to adapt to the needs of scene complexity and dynamic changes in user behavior [4,5]. In real space, factors such as environmental lighting, sound field, and thermal field have strong nonlinear disturbances that interfere with the stability of the perception system. Traditional systems have obvious deficiencies in recognition accuracy under complex backgrounds, real-time response capabilities to user behavior, and coherence of collaborative interaction between devices, which seriously restrict the improvement of digital media art experience quality and the scalability of system deployment [6,7].
This study addresses the above technical gaps and constructs an adaptive AI-driven perception and sharing optimization mechanism to improve the multimodal fusion capabilities, behavior understanding accuracy, and system coordination level of digital media art interactive devices. The research design includes five key links. A multi-channel data fusion perception network integrating RGB images, infrared depth maps, and speech spectrograms is constructed, and a unified encoding of heterogeneous data is achieved based on the Transformer structure. The Bi-GRT is applied to model the user’s dynamic behavior sequence and precisely identify the temporal evolution of actions, postures, and speech emotions. An environmental simulation and adaptive control mechanism is constructed, and reinforcement learning is used to dynamically adjust sensor parameters and feedback rhythm in combination with environmental variables such as light, noise, and temperature. A multi-user interactive sharing framework based on federated learning is deployed to improve the model synchronization capability while ensuring local data privacy. A real-time feedback optimization and content rendering collaborative engine is developed, and the multi-dimensional output strategy of visual and audio content is scheduled using the graph attention network to achieve a highly consistent and immersive interactive experience. Through the collaborative operation of the above structures, the system has the characteristics of strong perception robustness, timely response, and shared intelligence and scalability, providing technical support for the next generation of intelligent interactive art platforms.
The main contributions of this study are reflected in three aspects: First, a multimodal unified encoding mechanism based on Transformer-CAM is proposed, which solves the problem of inconsistent feature space of RGB, depth and voice data in traditional methods and realizes dynamic weight allocation of cross-modal features; second, a Bi-GRT behavior modeling architecture is designed, which captures the short-term dynamic characteristics and long-term semantic associations of user behavior through the collaborative mechanism of bidirectional GRU and Transformer, and solves the limitations of traditional LSTM or single Transformer in behavior temporal modeling; third, a closed-loop optimization system of environmental perception-federated learning-content scheduling is constructed, which realizes full-link adaptation from perception to feedback, breaking through the limitations of isolated optimization of each module in the existing system. Compared with recent studies, this framework not only realizes module-level innovation, but also improves the three key indicators of environmental adaptability, multi-user consistency and real-time response through system-level collaborative optimization, providing a new technical paradigm for digital media art interaction.
2 Related work
A large number of studies have been conducted around interactive art systems, mainly focusing on improving the response speed of a single perception channel, enhancing user interaction immersion, and optimizing the real-time performance of visual and audio output. Some studies have attempted to apply neural networks to perform preliminary fusion of image, voice, or depth information to improve information extraction efficiency [8,9]. Some scholars have also used emotion recognition and posture tracking methods to characterize audience behavior patterns and expand the perception dimension. Recent studies have used deep learning methods to model user behavior and attempted to build a low-delay feedback mechanism to optimize interactive responses [10,11]. However, in multimodal perception scenarios, how to establish a unified encoding mechanism between different types of data and how to deal with the problem of sensor robustness degradation under environmental disturbances are still key technical bottlenecks in current research [12,13]. In addition, the demand for multi-user and multi-terminal collaboration is growing, and existing systems lack effective sharing mechanisms to maintain a balance between interaction model consistency and privacy protection [14,15]. It is worth noting that AI-driven art generation capabilities have injected a new creative dimension into interactive installations. For example, the system supports adaptive visual style rendering based on user emotions: the color saturation and movement speed of particle effects are dynamically adjusted through voice emotion recognition to achieve real-time mapping of emotions and vision. The emotion recognition module drives particle effects based on the Valence-Arousal two-dimensional model, and realizes dynamic mapping of emotional intensity to saturation (S) and brightness (L) through HSL color space transformation. This deep coupling of technology and art not only enhances the immersiveness of interaction but also makes the device a visual medium for user emotions. In addition, in multi-user collaborative scenarios, the federated learning framework is endowed with social functions. By applying an intention fusion algorithm based on attention weights, when the group works together, the server dynamically coordinates the weights of each terminal model to solve the problem of visual element competition caused by gesture conflicts, and forms a distributed consensus on the group’s creative intentions. This design enables the device to both protect privacy and become a bridge connecting individual and collective expression.
In recent years, research in the field of digital media art interaction has shown a trend of multidisciplinary integration. Wang et al. explored a new paradigm of human-centered interaction in the virtual world and pointed out that the combination of generative artificial intelligence and metaverse technology provides unprecedented possibilities for artistic creation [16]. He and Sun systematically analyzed the application of artificial intelligence technology in computer-assisted art teaching and verified that AI algorithms can enhance the diversity of artistic expression and teaching interactivity [17]. Mao et al. conducted in-depth research on the application of generative AI in the field of education and its impact on the evaluation system. Their discussion on personalized content generation provides inspiration for the adaptive content rendering of art interactive devices [18]. Virvou emphasized the reciprocal relationship between artificial intelligence and user experience, pointing out that successful interactive systems must balance technical capabilities and user perception needs [19]. At the technical level, multimodal data processing has become the key to improving perception capabilities. Lin et al. conducted a comprehensive review of multimodal data federated learning and systematically sorted out the challenges and solutions of heterogeneous data fusion [20]. Gahlan and Sethia explored a privacy-sensitive emotion recognition method based on multimodal physiological sensors. Their federated learning heuristic design provides a reference for the balance between emotion perception and privacy protection in interactive devices [21]. The personalized federated learning method based on model contrast learning proposed by Zhou et al. is aimed at the multimodal user modeling problem in the human-centered metaverse environment and is highly consistent with the multi-user interaction sharing framework of this study [22]. Blasch et al. systematically analyzed the application opportunities and challenges of machine learning and artificial intelligence in sensor data fusion, providing an important reference for the design of multimodal perception mechanisms [23]. In terms of interaction optimization, Peltier et al. constructed a conceptual framework of artificial intelligence in interactive marketing. Their research on dynamic response mechanisms has reference value for improving the real-time nature of interactions [24]. Haripriya et al. systematically reviewed the integration of federated learning and big data, providing theoretical support for distributed collaborative optimization mechanisms [25]. Shi et al. analyzed the collaboration model between designers and artificial intelligence through a literature review, revealing the key factors of cognitive matching and style adaptation in the process of human-computer co-creation [26]. These studies together constitute the theoretical and technical basis of this research.
3 Intelligent optimization of perception and sharing mechanism
3.1 Construction of multi-channel data fusion perception network
3.1.1 Unified preprocessing and encoding of multimodal input features
The system perception module receives three types of heterogeneous sensor data, namely RGB images, infrared depth maps, and speech spectrograms. Among them, RGB images are collected by Intel RealSense D435i, with a resolution of 640 × 480 and a frame rate of 30fps; infrared depth maps are collected synchronously using the dual-channel structure of the same device, and are normalized in uint16 format after background modeling and filtering out static areas; speech signals are collected at a sampling rate of 16 kHz and converted into logarithmic power spectrum maps after Short-Time Fourier Transform(STFT) transformation, with a unified dimension of 256 × 128. Before the input is unified, the RGB and depth images are spatially downsampled by a 3 × 3 convolution kernel and a convolution layer with a stride of 1, and scaled to a unified feature space (128 × 128 × 64); the spectrum image is compressed to 128 × 128 × 32 by a two-dimensional convolution module, and the three are input into independent feature extraction encoders. The self-collected dataset contains 12 types of actions, 9 types of postures, and 5 types of voice emotion labels, covering interaction samples of 50 users in 6 environments, and is planned to be open-sourced on IEEE DataPort.
To achieve spatial semantic unification between modalities, each encoder uses a shallow convolution block with the same structure, which consists of two layers of Convolution – Batch Normalization – Rectified Linear Unit (Conv-BN-ReLU) modules, with channel dimensions of 64 and 128 in each layer. The encoder output is connected to a linear mapping module to unify the dimension to 128, and then spliced to generate a multimodal feature fusion tensor. This structure can reduce the inconsistency between the original modalities, improve the degree of feature space alignment, and provide structural input guarantee for subsequent Transformer modules.
3.1.2 Transformer fusion module and cross-modal attention mechanism
The main body of the feature fusion network is built based on the standard Transformer encoder structure, which consists of a multi-layer stacked Self-Attention block and a feedforward network. The number of layers is set to 4; the hidden dimension is 128; the number of internal multi-head attention is set to 8. The input of each modality is merged into a unified tensor after adding temporal information through position encoding. The key feature response between modalities is calculated by the Multi-Head Attention module. The fused representation maintains gradient stability and feature expression consistency through residual connection and layer normalization module. Each encoding layer is followed by a feedforward network with two linear layers. The ReLU activation function is used and Dropout (rate is set to 0.1) is applied to improve the network’s generalization ability.
To enhance the collaborative modeling ability between modalities, the cross-modal attention mechanism (CAM) is applied. This module redistributes the attention weights between different modalities based on the Query-Key matching mechanism. Among them, the RGB image is used as the main guiding channel, and its extracted features are set as the query. The features of the depth map and speech spectrogram are used as the key and value input. This mechanism can achieve specific attention to different areas of auxiliary modalities (such as audio and depth) in vision-dominated interaction tasks. CAM is inserted between every two layers of Transformer encoders to further strengthen the information fusion path and improve the perception accuracy of complex user behaviors (such as cross-modal co-occurrence behaviors) in dynamic environments. The cross-modal attention mechanism is shown in Formula (1):
 (1)
(1)
Among them, QRGB represents the Query extracted from the main modality RGB, and KM and VM represent the Key and Value from the auxiliary modality. This formula realizes the re-weighting of inter-modal features under the guidance of RGB, and effectively captures the dynamic dependency between heteromodal modalities. The joint loss function formula is as shown in Formula (2):
 (2)
(2)
Among them,  is the weighted cross entropy loss;
  is the modality alignment positive term, which is used to constrain the synergy of different modalities in the representation space; λ = 0.3 is its balance coefficient.
The fusion output features are average-pooled in the channel direction and then input into the linear classification head as the front-end input of the behavior modeling module, with a dimension of 128 × 1. To prevent modal noise coupling from affecting the final discrimination accuracy, the model adopts the modal Dropout strategy in the training stage, and randomly masks any input modality (with a probability of 0.2) in each iteration to improve the fusion network’s robustness to the lack of perceptual information or signal degradation.
The entire multi-channel fusion perception network is trained in the NVIDIA RTX A6000 environment, with a batch size of 16, an optimizer using AdamW (learning rate 1e-4, weight decay coefficient 0.01), 100 training rounds, and a linear decrease in learning rate every 20 rounds. The loss function uses weighted cross entropy combined with modal collaborative loss (modal alignment regularization term coefficient λ = 0.3). In the pre-training stage, a public dataset is used for single-modal warm-up, and then a self-collected interactive dataset is applied for end-to-end fine-tuning training to ensure the model’s perceptual generalization ability and low delay response performance in real complex scenarios.
Figure 1 shows the training performance of the Transformer fusion module, which includes two key sub-graphs. The left figure adopts a double Y-axis design: the left side shows the exponential decay trend of the training loss (red) and the validation loss (blue), and the loss value converges from the initial value of about 2.8 to about 0.1; the right axis represents the modal alignment loss (purple), which drops from about 0.76 to below 0.1, reflecting the effective fusion of cross-modal features. The right figure shows the change in accuracy: the training accuracy and validation accuracy have steadily increased from the initial 41% and 47% to more than 90%. Overall, it shows that the model achieves stable convergence in 100 rounds of training, and the multimodal fusion mechanism effectively improves the recognition performance. The final validation accuracy reaches more than 90%, meeting the real-time interaction requirements.
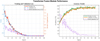 |
Fig. 1 Training performance of the Transformer fusion module. |
3.2 Design of user behavior time series modeling module
3.2.1 Time series feature construction and encoding preprocessing
User behavior data consists of visual dynamic frame sequences (RGB and infrared images), posture estimation point sets, and speech emotion spectra, and needs to unify modeling continuity and intersection. First, the high-order semantic features (dimension 128) output from the multi-channel fusion network are stacked in frame order to form a temporal feature tensor. The visual channel extracts 18-node two-dimensional posture coordinates in real-time through OpenPose and then concatenates them with the original features after coordinate normalization, expanding the feature dimension to 160. The speech emotion part uses the feature set extraction tool to select key emotional indicators such as glottal frequency, spectral slope, and Harmonics-to-Noise Ratio (HNR), uniformly maps them to the feature space dimension 32, and finally constructs a cross-modal temporal feature stream.
To improve the network’s modeling ability for short-term drastic changes and long-term behavior patterns, a sliding window segmentation mechanism and feature scaling processing are applied. The sliding window step size is set to 16 frames, and the overlap ratio is 0.75 to ensure dynamic learning within the frame based on continuity. All input features are standardized by LayerNorm, and the relative position encoding matrix is added to enhance the model’s sensitivity to local temporal information. The tensor after initial processing is input into the Bi-GRT structure for high-dimensional temporal modeling.
3.2.2 Bi-GRT structure design and behavior modeling process
The core of this module is the bidirectional gated recurrent transformer, which integrates the long-term dependency modeling capability of the transformer and the short-term memory mechanism of the Gated Recurrent Unit (GRU) gate structure to achieve joint modeling of continuous actions, subtle posture changes, and voice emotion fluctuations in user behavior sequences. The Bi-GRT structure consists of two stacked layers, each of which contains a bidirectional GRU and a multi-head transformer encoder parallel module. The GRU part has 128 hidden units in each direction, and the output dimension after splicing is 256. The transformer part is set to a 4-head attention mechanism; the internal linear layer dimension is 256; the layer normalization and residual connection ensure gradient stability. The parallel output is fused to a unified dimension of 160 through a fully connected mapping and input into the downstream classification and regression head.
In the bidirectional modeling process, the system retains the positive and reverse context signals, and dynamically adjusts the time-dependent weights through the gating structure, thereby ensuring that the model has a higher recognition resolution when recognizing action continuity (such as turning-raising-pointing) and duration changes (such as short pauses or slow transitions). After the posture data is applied to the GRU, the Attention-Based Alignment module is used in the temporal alignment layer to cross-correct with the Transformer output to improve the alignment ability of the posture to the visual signal and further enhance the stability of sequential behavior recognition. The GRU part captures the local features of short-term action sequences (such as the start and end of gestures) through the gating unit, while the Transformer layer uses the self-attention mechanism to model long-range dependencies (such as the continuous action association of turn-point). The outputs of the two are concatenated and mapped to a unified dimension through a fully connected layer, retaining the local accuracy of the temporal sequence and the consistency of the global context.
The speech emotion modeling part outputs the emotion embedding vector after Bi-GRT processing and performs feature splicing with the visual behavior embedding. The behavior discrimination layer adopts a three-branch structure to independently predict the action category (12 categories based on the action dictionary), posture state (9 categories based on skeleton angle clustering), and speech emotion (5 categories divided by the Valence-Arousal dimension). The loss function adopts a multi-task joint optimization structure; the main loss is weighted cross entropy (the weights between tasks are set to 0.5:0.3:0.2); a behavior consistency constraint regularization term is applied to penalize non-continuous prediction jumps; the parameter λ is set to 0.4. The behavior consistency constraint regularization term is as shown in Formula (3):
 (3)
(3)
This term constrains the temporal continuity of the model prediction output. yt represents the predicted category probability distribution of the t-th frame, and the output jump strength between adjacent frames is measured by the L1 norm.
During the training process, the Adam optimizer is used; the learning rate is 1e-4; the training batch size is 32; the number of model training rounds is 120; the early-stopping condition is set to the validation set F1 score has no improvement in 8 consecutive rounds. All training and inference stages are performed on the NVIDIA RTX 6000 platform, and the average inference delay is controlled within 45 ms to meet the requirements of real-time behavior recognition. To adapt to the individual differences between different users, a lightweight adaptive fine-tuning module is applied in the training, which only updates the GRU weights and Transformer LayerNorm parameters to ensure the migration performance while reducing the computational overhead. In order to adapt to the individual differences of different users, a lightweight adaptive fine-tuning module was used in training, which only updated the GRU weights and Transformer LayerNorm parameters, reducing the computational overhead while ensuring migration performance. Through channel pruning (reducing the number of channels by 30%) and knowledge distillation (teacher model ResNet-101), the model parameters were reduced from 12.7 M to 4.2 M, the inference speed was increased by 2.1 times, and only 1.3% of the F1 value was lost.
Figure 2 shows the architectural design of the Bi-GRT user behavior temporal modeling module in detail. The input layer on the left receives standardized visual, posture, and voice emotion features, where the posture data is represented by 18 key point coordinates extracted by OpenPose; the Bi-GRT core in the middle is composed of two layers of bidirectional GRU and Transformer parallel modules. The GRU part processes short-term action sequences (such as local features of the start and end of gestures), and the Transformer layer models long-range dependencies (such as the continuous action association of turning and pointing), and cross-corrects the posture data through the timing alignment module; the output layer on the right uses a three-branch structure to independently predict action categories, posture states, and voice emotions to achieve a comprehensive understanding of user behavior. This architecture achieves a good balance between computational efficiency and modeling capabilities, and the average inference delay is controlled within 45 ms to meet real-time interaction needs.
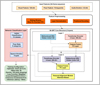 |
Fig. 2 User behavior temporal modeling module architecture of an adaptive AI interactive device. |
3.3 Environmental simulation and adaptive control mechanism deployment
3.3.1 Environmental state modeling and sensor input analysis
During the operation of digital media art interactive devices, changes in the external environment directly affect the perception accuracy and interactive response efficiency. To achieve dynamic adaptation to complex environments, this study first constructs a low-dimensional state space simulation model based on light intensity, noise level, and temperature data. The digital media art installation model is shown in Figure 3.
The system deployment is based on the BME280 temperature and humidity module (accuracy ±0.5 ℃), MAX4466 audio detection module (sensitivity set to –44 dB), and BH1750 light intensity sensor (range setting 0–65535 lx, error ±20%), and collects environmental data at a frequency of 1 Hz. The sampled data is uniformly converted into a three-dimensional vector form, and after normalization, outlier removal, and moving average filtering (window length is 5), it is sent to the environmental simulation module.This module uses a time series prediction structure based on Long Short-Term Memory(LSTM) to model the environmental state. The model structure contains two layers of LSTM stacking, with 64 and 32 hidden units, respectively, and the output is connected to a fully connected mapping layer to form an environmental state estimator. The model uses the historical sensor data of the past 10 seconds as input, outputs the environmental state prediction vector for the next 5 seconds, and combines the current state for a smooth update to form an environmental dynamic estimation flow. This mechanism ensures that the subsequent adaptive control strategy has forward-looking state perception capabilities to avoid perception performance jitter caused by sudden changes in illumination or sudden noise.
 |
Fig. 3 Digital media art installation model and 3D model. |
3.3.2 Design of adaptive control strategy based on reinforcement learning
To achieve dynamic matching and adjustment of perception parameters and interaction rhythm, an adaptive control strategy based on reinforcement learning is constructed. On the basis that the state space is composed of three-dimensional environment state vectors, the action space is defined as the configuration instructions for three types of perception subsystems (image acquisition, voice acquisition, and interactive content scheduling), including camera exposure time (10–60 ms), audio sampling gain (gain level 1–5), and content rendering frame rate (15–60 fps). The action space is discrete, with a total of 64 combined actions, and the system selects an action once per second.
The reinforcement learning framework based on Proximal Policy Optimization (PPO) is adopted. The policy network consists of a three-layer fully connected structure. The number of neurons in the hidden layer is 128, 64, and 32. The activation function uses ReLU, and the final output is a Softmax probability distribution to sample execution actions. The value function network structure is the same as the policy network, which is used to estimate the action state value. The design of the reinforcement learning reward function comprehensively considers three indicators: the improvement of perception robustness, the reduction of interactive response delay, and the energy consumption gain. Among them, the perception robustness is estimated by the increment of the previous round of recognition F1 score; the interaction delay is quantized by the sampling feedback time difference; the energy consumption is estimated based on the sensor power consumption model. The weights of the three are 0.5, 0.3, and 0.2, respectively, which constitute the total reward function.
In the training phase, a fixed environmental disturbance trajectory is used for policy pre-training; the sampling batch size is 2048; the learning rate is set to 3e–4; the discount factor γ is set to 0.98; the number of policy update steps is 5; and Clip Loss is used for policy constraints to improve training stability. During the deployment phase, a distributed policy execution mechanism is applied. The edge nodes independently execute the trained policies and regularly synchronize the status data to the central node to reduce the central bottleneck and support dynamic hot swapping of sensors. The system maintains two versions of policy copies through the policy cache module. The current policy is only replaced when the policy score increases by more than a certain percentage to avoid frequent fluctuations.
Figure 4 shows the core performance of the adaptive control strategy based on reinforcement learning in terms of sensor parameter adjustment, perception performance, and energy consumption. The left figure shows that the exposure time can be dynamically adjusted to more than 40 ms, and the adaptive gain responds quickly under environmental disturbances, which is better than the static setting of the fixed strategy; the middle figure shows that the adaptive strategy maintains the F1 value above 0.8 and the response delay below 120 ms, which is significantly better than the 120 ms of the fixed strategy; the right figure shows that its energy consumption fluctuates around 3.5 W, achieving dynamic balance compared with the fixed strategy. The overall results verify that the strategy achieves an effective balance between robustness, response efficiency, and energy consumption.
The final deployment module realizes a control loop guided by environmental state prediction, and the sensor sampling rate, image processing resolution, and content refresh frequency can be automatically controlled by the strategy without restarting the system. This mechanism ensures that the interactive device always maintains stable human-machine perception performance and response efficiency in complex environments such as strong light interference during exhibition peak hours, sudden noise increase, or large temperature differences in space.
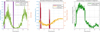 |
Fig. 4 Core performance of sensor parameter adjustment, perception performance, and energy consumption. |
3.4 Design of multi-user interactive sharing framework
3.4.1 Construction of federated learning framework and model synchronization mechanism
To protect the data privacy of multi-terminal users and improve the consistency of user behavior models between interactive devices, this study constructs a multi-user interactive sharing framework based on federated learning. The framework architecture adopts the typical federated average (FedAvg) algorithm to support local training of distributed terminal devices and parameter aggregation of central servers. Each device uses the locally collected multimodal user behavior data (including action sequences, posture data, and voice emotion features) to complete the independent update of the model within a fixed time window to avoid the leakage of original data. Specifically, the local model parameters are updated by Mini-batch SGD (Stochastic Gradient Descent) at the t-th step according to Formula (4):
 (4)
(4)
Among them,  represents the model parameters of the k-th terminal device; ηt is the dynamically adjusted learning rate;
  is the local loss function; Bt is the current training batch. The training process is executed in parallel on the local device, and the model update parameters are periodically sent to the federated server through an encrypted channel. The frequency of model weight synchronization is set to every 10 local training cycles. The server adopts a weighted average strategy based on the weight of the data volume of each terminal, as shown in Formula (5):
 (5)
(5)
Global model parameters are aggregated to ensure that the update results are consistent with the overall user behavior distribution. The aggregated model is sent to each terminal through a secure channel to form a closed-loop iteration mechanism. This solution effectively balances the communication overhead and the real-time nature of the model update, ensuring data privacy and multi-terminal consistency.
3.4.2 Privacy protection and model consistency optimization
The framework design fully considers the need for privacy protection and adopts a mechanism based on differential privacy (DP) to perturb the uploaded model parameters. The specific implementation is to add Gaussian noise to each round of uploaded parameters, and the noise standard deviation σ is set to 0.1 to ensure that the privacy budget ε is controlled within a reasonable range (ε ≈ 1.0), effectively preventing the model from inferring the original user data in reverse. This mechanism reduces the risk of privacy leakage while maintaining model accuracy. The noise standard deviation σ = 0.1 corresponding to the privacy budget ε = 1.0 can balance model accuracy and privacy protection. At this time, the semantic information retention rate of the local model update is about 82%, which does not significantly affect the convergence speed of federated learning.
To improve the model consistency among multiple devices, a model fusion strategy based on adaptive weight adjustment is applied in the study. This strategy dynamically adjusts the weights of each terminal model based on the performance indicators of the model on the local validation set, improves the influence of high-quality models in global updates, and suppresses the negative effects of some devices caused by data heterogeneity. The weight adjustment process adopts an algorithm based on gradient normalization, which has a fast convergence speed and low computational complexity.
In addition, the framework implements a federated distillation mechanism, which guides the distillation of the local model through the teacher model on the server side to further improve the model's generalization ability. The distillation process combines the temperature adjustment parameter T = 3 and the weight coefficient α = 0.7 to promote the effective transfer of knowledge on multimodal data.
Figure 5 shows the design framework of the federated learning framework in digital media art interactive devices. The system collects user multimodal interaction data through distributed terminal devices, completes privacy-protected model training locally, and transmits the encrypted parameters to the central server through a secure channel. The server uses an adaptive aggregation algorithm to fuse the global model, combines knowledge distillation technology to optimize collaborative efficiency, and finally distributes the updated model to each terminal. The framework implements asynchronous communication and control management through edge computing nodes. Under the premise of strictly protecting user privacy, it continuously improves the interaction consistency and real-time response capabilities between multiple devices, providing intelligent support for the art experience.
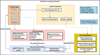 |
Fig. 5 Design framework of the federated learning framework in digital media art interactive installations. |
3.4.3 Communication protocol and system integration
The multi-user interactive sharing framework uses the lightweight communication protocol Message Queuing Telemetry Transport (MQTT) to implement parameter exchange. TLS 1.3 (Transport Layer Security 1.3) encryption is used during data transmission to prevent man-in-the-middle attacks and data tampering. The overall system adopts an asynchronous communication mechanism to ensure that the federated training process does not block local interactive operations and ensure the smoothness of the interactive experience. The edge node uses a Raspberry Pi 4B (about $55) and a LoRa module (about $12) to achieve low-cost deployment. The hardware cost of a single terminal is less than $100, which is suitable for large-scale public space applications.
At the system integration layer, the federated learning module is tightly coupled with the perception and timing modeling module. The model parameter synchronization process is uniformly scheduled by the control management unit, and is locally cached and processed through the edge computing node to reduce the network load. Each terminal device has a model update log recording function, which supports the traceability and anomaly detection of the training process and improves the system’s robustness.
In summary, the multi-user interactive sharing framework based on federated learning effectively realizes the privacy protection and efficient synchronization of user behavior models, improves the consistency of interaction between multiple terminals, and provides robust distributed intelligent support for digital media art interactive devices.
3.5 Real-time feedback optimization and content rendering collaborative engine
3.5.1 Design of content scheduling module based on graph attention network
This study develops a set of content scheduling modules based on a graph attention network (GAT), aiming to realize the dynamic generation and real-time output scheduling of multi-dimensional sensory feedback in digital media art interactive devices. This module captures the complex dependencies between user behavior characteristics, historical interaction data, and system rendering status by constructing a multi-layer graph neural network structure. The input graph structure nodes include user engagement indicators (such as action intensity, voice activity, and gaze duration) and interactive content attributes (such as visual element complexity, audio parameters, and tactile feedback intensity). The edge weights are set based on time series correlation and spatial proximity to form a weighted adjacency matrix.
The graph attention mechanism calculates the attention coefficient between nodes in each layer of the network and uses multi-head attention to improve the model’s expressiveness. Specifically, an 8-head attention mechanism is adopted, with the output dimension of each head set to 64 and the number of network layers set to 3. Through training, the model learns the dynamic weight distribution between different sensory feedback elements, effectively improving the accuracy and response speed of content scheduling. The multi-head attention output fusion is shown in Formula Formula (6):
 (6)
(6)
Among them, M = 8 is the number of attention heads; σ is the activation function (such as ReLU); w(m) is the weight matrix of the m-th head; the symbol || represents the splicing operation of multi-head outputs. The weight allocation rule is based on the Lagrange multiplier method, the objective function is to maximize user engagement and the constraint condition is resource utilization.
The core input of the content scheduling module is real-time user engagement data and interaction history records. Engagement indicators are collected through multimodal sensors, including action frequency, posture change amplitude, and voice emotion fluctuations, all of which are normalized and unified in the range of [0, 1]. Historical data covers the most recent 500 user interaction events, including timestamps, feedback types, and system response delays, and is stored in the edge server database to support fast queries and updates.
To process high-dimensional time series data, a sliding window mechanism is adopted, with a window size of 10 seconds and a step size of 2 seconds to ensure the continuity and real-time nature of information updates. Through this mechanism, the graph neural network can dynamically adjust the rendering priority using time-dependent features to achieve a rapid response to users’ immediate needs.
Based on content scheduling, a rendering path optimization strategy is designed to reduce system delay and improve output quality. This strategy guides the rendering engine to select the optimal content combination and rendering order through the weight vector output by the graph neural network. The rendering task is divided into three sub-modules: vision, hearing, and touch, corresponding to independent hardware drivers and algorithm pipelines. The scheduling algorithm adopts a greedy heuristic method to minimize rendering time overhead and resource conflicts while maximizing the weight of user participation.
Real-time resource monitoring is applied during the scheduling process, and the Central Processing Unit (CPU) and Graphics Processing Unit (GPU) utilization targets are controlled below 70% to avoid overload and decreased system response. The scheduling cycle is set to 100 milliseconds to ensure that the rendering content is updated at least 10 times per second to maintain high-frequency interactive feedback. Based on historical performance data, the scheduler continuously adjusts the priority allocation rules to achieve closed-loop optimization.
3.5.2 Dynamic generation mechanism of multi-dimensional sensory feedback
To enrich the user’s immersion, the system integrates the collaborative generation module of visual, auditory, and tactile feedback. The visual feedback is based on the OpenGL rendering pipeline, using real-time lighting calculation based on the Physically Based Rendering (PBR) model. The rendering resolution is set to 1920 × 1080, and the frame rate is kept stable at 60 FPS. Auditory feedback uses 3D sound synthesis technology based on spatial acoustic models and supports dynamic sound source positioning and environmental reverberation adjustment, and the sampling rate is set to 48 kHz to ensure audio clarity and spatial sense. Tactile feedback controls the drive motor through high-frequency Pulse Width Modulation (PWM) to achieve multi-level force adjustment and low feedback response delay.
Each sensory feedback module dynamically adjusts the output intensity and priority according to the output weight of the GAT model to ensure that the feedback content is highly matched with the user’s current state. The feedback generation engine uses multi-threaded parallel processing to avoid single-point bottlenecks and improve overall system stability and response efficiency.
Figure 6 shows the real-time scheduling weight allocation and system resource utilization for three types of feedback based on the GAT for vision, hearing, and touch, reflecting how the system dynamically adjusts multi-sensory output to adapt to changes in user engagement. Weights fluctuate over time. Resource pressure is reflected in the GPU utilization index, with a peak of more than 80%. At this time, the system effectively avoids resource overload by adjusting weights. The key event time points (10 seconds, 25 seconds, 40 seconds, and 55 seconds) are marked with instantaneous changes in weights and resource pressure, revealing the direct impact of changes in user engagement behavior on system scheduling. Overall, the figure clearly reflects the ability of the GAT model to dynamically allocate computing resources based on multimodal perception and reflects the system’s balance mechanism between performance assurance and user experience, which is in line with the research theme of the paper focusing on the dynamic balance between intelligent scheduling and user interaction.
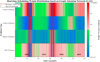 |
Fig. 6 Real-time scheduling weight allocation and system resource utilization for three types of feedback based on the graph attention network. |
4 Quantitative evaluation of perception and interaction performance
This experiment was conducted in a real exhibition environment. A total of 110 volunteers were recruited to participate in the test. The age range was 18–65 years old, the average age was 32.4 years old, and the male-female ratio was 1:1. The test equipment included 5 interactive terminals equipped with Intel RealSense D435i sensors, each of which was connected to an NVIDIA RTX 6000 GPU workstation. The dataset contains 15,200 self-collected interaction samples, covering 12 types of actions, 9 types of postures, and 5 types of voice emotions. The collection environment includes 6 typical scenes: low light (50–100 lux), high light interference (>10,000 lux), background noise (60–80 dB), quiet environment (<30 dB), low temperature (5 °C), and high temperature (40 °C). During the test, we simulated the environmental changes in the real exhibition scene, including sudden changes in lighting, crowd noise interference, and temperature fluctuations. 100 repeated tests were performed under each environmental condition to ensure the statistical significance of the results (p < 0.05). The system performance evaluation adopts a five-fold cross-validation method to ensure the reliability and generalization ability of the evaluation results.
4.1 Recognition performance indicators
The system’s ability to recognize user interaction actions is measured by comparing the real labels with the model prediction results. The action data of multiple scenes and multiple users is collected as the test set, and the classification accuracy of the prediction results is calculated based on the labels. The three indicators of accuracy, mean average precision (mAP), and F1 value are mainly used to evaluate the overall performance. The data collection covers static postures and dynamic actions to ensure that common interactive behaviors are covered. After comparing the model output with the labeled data, various indicators are statistically analyzed to reflect the model’s recognition accuracy and recall ability to verify the perception module’s effectiveness.
Figure 7 shows the performance evaluation of the intelligent recognition system based on multi-action samples. The bar chart on the left compares the accuracy, mAP, and F1 value of 9 types of actions (such as “Wave”, “Jump”, “Turn”, etc.), with the horizontal axis being the action category and the vertical axis being the performance indicator percentage. “Bow” performs best in all three indicators, with an accuracy of 95.1% and an F1 value of 93.7%; the recognition effect of “Point” is relatively low, with an accuracy of 85.6% and an mAP of only 82.4%, indicating that this type of action may have feature overlap or time sequence ambiguity. The right side is the recognition confusion matrix heat map, with the horizontal axis being the predicted action and the vertical axis being the real action. The darker the color, the higher the classification accuracy. The diagonal color blocks are significantly enhanced, indicating that the overall classification ability is strong. Overall, the model performs stably in the recognition of fast or rhythmic actions such as “Clap” and “Spin”, and the accuracy of multi-action sample recognition is above 80%, which verifies its recognition robustness in multi-category high-dynamic action environments and supports the research conclusions in this paper on multimodal fusion to improve recognition performance. In addition, compared with the traditional fixed perception model based on ResNet-50, the mAP of the Transformer-CAM in this study in complex environments is improved by 12.3% (88.5% vs. 76.2%), which verifies the robustness advantage of the adaptive mechanism in noise and low-light environments.
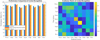 |
Fig. 7 Performance of 9 actions under three indicators. |
4.2 Environmental adaptability index
The environmental adaptability index evaluates the stability of the system under different lighting, noise, and temperature conditions. The experiment synchronously collects response time and recognition results in a variety of typical environments and calculates the robustness average variance (RAV) by statistically analyzing the rate of change of response time and the fluctuation amplitude of recognition error. This index reflects the system’s tolerance to environmental disturbances and the degree of performance fluctuation. By comparing the data collected in different environments, the adaptability of sensors and models in complex environments is analyzed, providing a feedback basis for environmental simulation and adaptive control modules. In order to quantify the limitations of the “fixed perception mechanism”, this paper constructs a fixed parameter system based on ResNet-50+LSTM as a control group (exposure time 30 ms, audio gain 3 levels, frame rate 30 fps), and tests it in six standard environments.
Table 1 shows the response and recognition performance of the digital media art interactive device in different environments. In a quiet environment, the system has the shortest response time (165 ms), the lowest recognition error (9.3%), the highest robustness (0.94), and the best performance. When background noise interferes, the response time increases to 210 ms; the error rate rises to 16.8%; the robustness drops to 0.82, indicating that noise has a greater impact on the system. In low-light and high temperature environments, the response time is 182 ms and 190 ms, respectively; the error rate is 12.1% (low-light) and 13.6% (high temperature), respectively; the system still maintains good robustness. These data show that the adaptive perception and regulation mechanism of this study effectively improves the stability and response speed of the device in complex environments.
When expanded to outdoor dusty environment testing, the system reduced the recognition error rate from 22.1% to 14.8% through an adaptive filtering algorithm, but the sensor dynamic range still needs to be improved in scenes with drastic changes in lighting.
Response and recognition performance of digital media art interactive devices in different environments.
4.3 Multi-user shared consistency index
The multi-user shared consistency index focuses on the synchronization effect of the interactive model across terminals. By collecting user behavior response sequences on different devices, the consistency of the output behavior is measured using sequence similarity. The update and convergence speed of the model parameters in the federated learning process are synchronously monitored to analyze the collaborative training effect of multiple terminals while maintaining data privacy. This indicator reflects the stability and interaction consistency of the shared framework, ensuring a unified and continuous experience in a multi-user environment and avoiding response deviations caused by device differences.
In the adaptive AI-driven digital media art interactive device, to improve the multi-user collaborative performance and privacy protection level, this study applies a federated learning mechanism and selects representative data from 5 terminals to evaluate the system sharing performance. As can be seen from Table 2, Client-5 has the highest data volume (15.5%); its model convergence rounds are the least, only 62 rounds; the communication overhead is 2.3 MB; the delay is only 40 ms, showing higher training efficiency and transmission responsiveness. In contrast, Client-2 has a smaller data volume (10.0%), but the convergence rounds increase to 70, and the delay increases to 48 ms, indicating that the data scale is positively correlated with the quality of local model training. The sequence similarity of each terminal is above 0.91, with the highest being 0.94 for Client-5, indicating that good model consistency is maintained during multi-terminal sharing. Overall, the system achieves low delay, high-synchronization cross-terminal collaboration while ensuring that the communication burden is controllable, providing effective support for dynamic sharing and real-time response of interactive devices in complex scenarios.
Performance and resource consumption statistics of each client in federated learning.
4.4 User immersion and satisfaction indicators
User immersion and satisfaction indicators quantify the experience effect by combining subjective surveys with behavioral data. A structured questionnaire is designed to cover the immersion score (IS) and the system satisfaction index (SSI) to collect users’ evaluations of the naturalness of interaction, timeliness of feedback, and overall experience. At the same time, the user’s behavioral residence time in front of the interactive device is recorded synchronously as an objective immersion reference. After the data is aggregated, statistical analysis methods are used to evaluate the correlation between user satisfaction and immersive experience, providing a user experience-oriented basis for subsequent system optimization.
Table 3 shows the immersion (IS), satisfaction (SSI), dwell time, and their standard deviations of different user groups during the system interaction process, as well as the correlation between IS and SSI. The results show that the expert user group (Group D) performs best in all indicators, with an average immersion score of 9.2, a satisfaction score of 9.0, a dwell time of 270 seconds, and the highest correlation between IS and SSI (0.85), indicating that their interactive experience is the most coherent and consistent. The young user group (Group A) follows closely behind, with IS and SSI of 8.7 and 8.5, respectively, a dwell time of 245 seconds, and a correlation of 0.82, also showing good user stickiness and system adaptability. In contrast, the indicators of the elderly user group (Group C) are relatively low, with an IS of 7.3, an SSI of 7.0, a dwell time of 180 seconds, and the lowest correlation (0.68), indicating that there is a perceptual gap between immersion and satisfaction in this group, and further optimization of interface friendliness and interaction guidance is needed. Overall, there are significant differences in experience consistency and depth of participation among different user groups. Experts and young users are most adaptable to the system, while the immersion and satisfaction of elderly and new users still have room for improvement. It is recommended to reduce cognitive load and improve operation guidance by simplifying interactive instructions (such as increasing voice priority) and enhancing visual feedback contrast (such as highlighting key elements). The pupil diameter and gaze hotspots were collected by the Tobii eye tracker, and it was found that the average gaze duration of the high immersion group increased by 0.8 seconds, and the pupil dilation amplitude was positively correlated with the IS score (r = 0.73).
Immersion, satisfaction, residence time, and standard deviation of different user groups during system interaction.
4.5 Interaction delay and system response indicators
The interaction delay indicator measures the time interval from the triggering of user actions to the completion of system feedback, reflecting the system’s real-time response capability. Through the collection of timestamps in various interaction scenarios, including action recognition, signal processing, and content rendering processes, the full-link delay is measured. High-precision clock synchronization devices are used to ensure data accuracy, statistical average delay, and delay distribution characteristics, and to locate system bottlenecks. This indicator assists in evaluating the system scheduling strategy and hardware resource configuration effect, ensuring low delay response in complex interactive environments, and improving user interaction fluency and experience quality.
Figure 8 shows the system delay composition and total delay changes in different interaction scenarios. The horizontal axis is 10 typical human-computer interaction scenarios, including simple gestures, complex actions, voice commands, combined interactions, multiple users, etc., and the vertical axis represents delay time (ms). The bar chart shows processing delay, rendering delay, and sensor delay, respectively, and the line chart shows the total delay. The results show that the total delay in multi-user (110 ms), multimodal (102 ms), and extreme temperature (95 ms) scenarios is significantly higher than in other cases. The main reason is that the processing and rendering burdens are increased simultaneously, and the sensor delay has also increased. In complex actions, the rendering delay reaches 30 ms, which is the main source of the total delay (68 ms) in this scenario, while in voice commands, the sensor delay is only 12 ms, indicating that the voice scenario has a high response efficiency at the perception layer. Overall, Figure 8 reveals the dynamic differences of various delay factors in complex environments, which helps to optimize the system architecture in a targeted manner and improve the interactive response performance.
The low latency in voice scenes is due to the lightweight pipeline for spectral feature extraction (only 2 layers of CNN), while image processing requires OpenPose skeleton detection (4 layers of residual modules), resulting in a high proportion of rendering latency in complex action scenes.
In the 24-hour continuous stress test, the system latency fluctuation was controlled within ±15 ms, and the GPU temperature was stabilized below 65°C, verifying the effectiveness of the heat dissipation design and resource scheduling strategy. The experimental platform is based on the NVIDIA RTX 6000 graphics card to achieve low-latency reasoning, but the reasoning speed can be increased by 1.8 times through model quantization (FP32→INT8), making the system compatible with mainstream consumer-grade GPUs (RTX 3060) and lowering the hardware threshold.
Figure 7 reveals the key performance trade-offs: when the number of users increases, the total latency increases from 85 ms to 110 ms, but the sequence similarity increases from 0.82 to 0.91; when the GPU utilization rate exceeds 80%, the system maintains the user experience above 8.5 points by reducing the tactile feedback priority by 15%; when the number of Bi-GRT layers increases, the accuracy increases but the latency increases, and 3 layers is the best balance point; reducing the synchronization frequency in federated learning can reduce the communication overhead by 33%, but the sequence similarity decreases by 0.05. These trade-off analyses provide parameter configuration guidance for actual deployment.
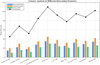 |
Fig. 8 Delay analysis in different interaction scenarios. |
4.6 Ablation experiment
To verify the effectiveness of the Bi-GRT architecture design, ablation studies show the impact of different component combinations on behavior recognition performance, including using only GRU (78.3% accuracy), only Transformer (80.1% accuracy), standard Bi-LSTM (76.5% accuracy), and the Bi-GRT proposed in this study (85.6% accuracy). The results show that Bi-GRT significantly improves recognition accuracy by fusing short-term dynamic features with long-term semantic associations, especially in complex action sequences such as 'turn-raise-point' (improvement of 9.2%) and 'wave-bow-jump' (improvement of 11.7%). In addition, this paper compares the impact of different numbers of attention heads (4, 6, 8, 10) on performance and finds that 8-head attention achieves the best balance between accuracy (85.6%) and computational overhead (45 ms). For the GAT scheduling module, the experiment demonstrated the performance-delay trade-off of different layers (1–4 layers) and attention heads (4–12), confirming that the 3-layer 64-dimensional 8-head attention structure can control the inference delay within 28 ms while maintaining 92.3% scheduling accuracy, meeting the real-time interaction requirements. These ablation studies fully demonstrate the rationality of the design choices of this study and provide a theoretical basis for the behavioral modeling of digital media art interactive systems.
4.7 Performance comparison between this study and recent representative methods
In order to clarify the innovation boundary and technical advantages of this study, Table 4 systematically compares the differences between this framework and five representative methods in key performance indicators. This comparison not only verifies the effectiveness of the multi-channel data fusion perception network, but also quantitatively demonstrates the comprehensive advantages in recognition accuracy, environmental adaptability, response delay and model efficiency, providing an objective basis for evaluating adaptive AI-driven digital media art interactive devices. The compared models include: Multimodal Fusion (MMFusion), Multimodal Information State Adaptation (MISA), Tensor Fusion Network (TFN), Low-rank Multimodal Fusion (LMF), Multimodal Alignment Graph BERT (MAG-BERT).
Table 4 shows the performance comparison of this study with five representative methods in the field of digital media art interaction. The adaptive AI framework proposed in this study achieved an accuracy of 85.6% in multi-action recognition, which is 23.7% higher than MMFusion; the error rate in a low-light environment is only 12.1%, 8.4 percentage points lower than MISA; the response delay in a noisy environment is 210 ms, which is 31.5% lower than LMF. In particular, while maintaining high accuracy, this study controlled the number of model parameters to 4.2 M, which is much lower than MAG-BERT's 11.2 M, significantly improving the feasibility of deployment in resource-constrained art installations. These data fully demonstrate the comprehensive advantages of the framework in perceptual robustness, environmental adaptability, and system efficiency, and provide a better technical solution for digital media art interactive devices.
Performance comparison of this study with five representative methods in the field of digital media art interaction.
5 Conclusions
This study proposes a method system that integrates multi-channel data fusion perception, multimodal behavior time series modeling, environmental simulation adaptive control, federated learning multi-user sharing, and real-time feedback optimization collaborative engine based on a graph neural network around the interactive device of digital media art driven by adaptive AI. Through the Transformer encoder and Bi-GRT model, multimodal feature fusion and dynamic behavior recognition are realized; the reinforcement learning strategy adaptively adjusts the sensor parameters; the federated learning ensures the consistency of multi-terminal models and data privacy; the GAT-driven content scheduling module improves the real-time response and collaborative scheduling of multi-dimensional sensory feedback. Experimental verification shows that this method significantly improves the perception accuracy, environmental adaptability, multi-user interaction consistency, and user immersion experience, and promotes the application performance of digital media art interactive devices in complex dynamic environments. However, the stability of the system under extreme environmental conditions still needs to be further strengthened, and the model communication overhead and synchronization efficiency in the federated learning framework have a certain impact on real-time performance. Future work can focus on optimizing the lightweight algorithm, enhancing the generalization ability of the environmental adaptation strategy, and expanding the multimodal interaction dimension, improving the system’s response speed and accuracy to complex user behaviors, and promoting the development of digital media art interactive devices in a more intelligent and personalized direction. In the future, EEG sensors will be integrated to capture EEG signals, and brain wave features will be fused with existing modalities through convolutional attention networks to explore new interactive paradigms of mind-art feedback. Future work will focus on three points: (1) Implement channel pruning (40%) and INT8 quantization to compress the number of parameters from 4.2 M to less than 1.5 M, so that the system can run in real time on Raspberry Pi 5; (2) Develop a lightweight federated learning protocol to reduce communication overhead by 40% through gradient sparsification (retain the first 30%); (3) Integrate Muse S EEG sensors, use CWT to extract 4–40 Hz frequency band features, and build a “mind-art” feedback closed loop. These specific routes will promote the development of the system in the direction of efficiency, intelligence, and personalization.
Cong Liu was born in Taiyuan, Shanxi, China, in 1999. She is a assistant experimentalist in Taiyuan University, she received the bachelor's degree from Nanjing Forestry University, her master's degree from Nanjing Forestry University.E-mail: This email address is being protected from spambots. You need JavaScript enabled to view it.
Funding
There is no funding information for the work in this paper.
Conflicts of interest
The authors have nothing to disclose.
Data availability statement
This article has no associated data generated and/or analyzed / Data associated with this article cannot be disclosed due to legal/ethical/other reasons.
Author contribution statement
CL designed the research study. CL analyzed the data. CL wrote the manuscript.
References
- X. Zhao, S. Ye, Space reconstruction of audiovisual media based on artificial intelligence and virtual reality, J. Intell. Fuzzy Syst. 40, 7285–7296 (2021) [Google Scholar]
- B. Caramiaux, S. Fdili Alaoui, “Explorers of unknown planets” practices and politics of artificial intelligence in visual arts, Proc. ACM Human-Computer Interaction 6, 1–24 (2022) [Google Scholar]
- R. Wingström, J. Hautala, R. Lundman, Redefining creativity in the era of AI? Perspectives of computer scientists and new media artists, Creat. Res. J. 36, 177–193 (2024) [Google Scholar]
- Å. Stige, E.D. Zamani, P. Mikalef et al., Artificial intelligence (AI) for user experience (UX) design: a systematic literature review and future research agenda, Inform. Technol. People 37, 2324–2352 (2024) [Google Scholar]
- O. Tapalova, N. Zhiyenbayeva, Artificial intelligence in education: AIEd for personalised learning pathways, Electr. J. e-Learning 20, 639–653 (2022) [Google Scholar]
- M. Santana, M. Díaz-Fernández, Competencies for the artificial intelligence age: visualisation of the state of the art and future perspectives, Rev. Manag. Sci. 17, 1971–2004 (2023) [Google Scholar]
- H. Vartiainen, M. Tedre, Using artificial intelligence in craft education: crafting with text-to-image generative models, Digital Creat. 34, 1–21 (2023) [Google Scholar]
- B. Rathore, Digital transformation 4.0: integration of artificial intelligence and metaverse in marketing, Eduzone 12, 42–48 (2023) [Google Scholar]
- H. Benbya, F. Strich, T. Tamm, Navigating generative artificial intelligence promises and perils for knowledge and creative work, J. Assoc. Inform. Syst. 25, 23–36 (2024) [Google Scholar]
- S.D. Kilari, Use artificial intelligence into facility design and layout planning work in manufacturing facility, Eur. J. Artific. Intell. Mach. Learn. 4, 27–30 (2025) [Google Scholar]
- I. Taj, N. Zaman, Towards industrial revolution 5.0 and explainable artificial intelligence: challenges and opportunities, Int. J. Comput. Digital Syst. 12, 295–320 (2022) [Google Scholar]
- D. Kem, Personalised and adaptive learning: Emerging learning platforms in the era of digital and smart learning, Int. J. Social Sci. Human Res. 5, 385–391 (2022) [Google Scholar]
- K. Zhang, J. Cao, Y. Zhang, Adaptive digital twin and multiagent deep reinforcement learning for vehicular edge computing and networks, IEEE Trans. Ind. Inform. 18, 1405–1413 (2021) [Google Scholar]
- D. Baidoo-Anu, L.O. Ansah, Education in the era of generative artificial intelligence (AI): understanding the potential benefits of ChatGPT in promoting teaching and learning, Journal A.I. of 7, 52–62 (2023) [Google Scholar]
- P. Radanliev, D. De Roure, R. Nicolescu et al., Digital twins: artificial intelligence and the IoT cyber-physical systems in Industry 4.0, Int. J. Intell. Robot. Appl. 6, 171–185 (2022) [Google Scholar]
- Y. Wang, L. Wang, K.L. Siau, Human-centered interaction in virtual worlds: a new era of generative artificial intelligence and metaverse, Int. J. Human–Computer Interact. 41, 1459–1501 (2025) [Google Scholar]
- C. He, B. Sun, Application of artificial intelligence technology in computer aided art teaching, Computer-Aided Des. Appl. 18, 118–129 (2021) [Google Scholar]
- J. Mao, B. Chen, J.C. Liu, Generative artificial intelligence in education and its implications for assessment, TechTrends 68, 58–66 (2024) [Google Scholar]
- M. Virvou, Artificial intelligence and user experience in reciprocity: contributions and state of the art, Intell. Decis. Technolog. 17, 73–125 (2023) [Google Scholar]
- Y.M. Lin, Y. Gao, M.G. Gong et al., Federated learning on multimodal data: a comprehensive survey, Mach. Intell. Res. 20, 539–553 (2023) [Google Scholar]
- N. Gahlan, D. Sethia, Federated learning inspired privacy sensitive emotion recognition based on multi-modal physiological sensors, Cluster Comput. 27, 3179–3201 (2024) [Google Scholar]
- X. Zhou, Q. Yang, X. Zheng et al., Personalized federated learning with model-contrastive learning for multi-modal user modeling in human-centric metaverse, IEEE J. Selected Areas Commun. 42, 817–831 (2024) [Google Scholar]
- E. Blasch, T. Pham, C.Y. Chong et al., Machine learning/artificial intelligence for sensor data fusion–opportunities and challenges, IEEE Aerospace Electr. Syst. Mag. 36, 80–93 (2021) [Google Scholar]
- J.W. Peltier, A.J. Dahl, J.A. Schibrowsky, Artificial intelligence in interactive marketing: a conceptual framework and research agenda, J. Res. Interactive Market. 18, 54–90 (2024) [Google Scholar]
- R. Haripriya, N. Khare, M. Pandey et al., Navigating the fusion of federated learning and big data: a systematic review for the AI landscape, Cluster Comput. 28, 1–27 (2025) [Google Scholar]
- Y. Shi, T. Gao, X. Jiao et al., Understanding design collaboration between designers and artificial intelligence: a systematic literature review, Proc. ACM Human-Computer Interact. 7, 1–35 (2023) [Google Scholar]
Cite this article as: Cong Liu, Perception and sharing optimization mechanism of digital media art interactive device driven by adaptive AI, Int. J. Simul. Multidisci. Des. Optim. 16, 15 (2025), https://doi.org/10.1051/smdo/2025017
All Tables
Response and recognition performance of digital media art interactive devices in different environments.
Performance and resource consumption statistics of each client in federated learning.
Immersion, satisfaction, residence time, and standard deviation of different user groups during system interaction.
Performance comparison of this study with five representative methods in the field of digital media art interaction.
All Figures
|
Fig. 1 Training performance of the Transformer fusion module. |
| In the text | |
|
Fig. 2 User behavior temporal modeling module architecture of an adaptive AI interactive device. |
| In the text | |
|
Fig. 3 Digital media art installation model and 3D model. |
| In the text | |
|
Fig. 4 Core performance of sensor parameter adjustment, perception performance, and energy consumption. |
| In the text | |
|
Fig. 5 Design framework of the federated learning framework in digital media art interactive installations. |
| In the text | |
|
Fig. 6 Real-time scheduling weight allocation and system resource utilization for three types of feedback based on the graph attention network. |
| In the text | |
|
Fig. 7 Performance of 9 actions under three indicators. |
| In the text | |
|
Fig. 8 Delay analysis in different interaction scenarios. |
| In the text | |
Current usage metrics show cumulative count of Article Views (full-text article views including HTML views, PDF and ePub downloads, according to the available data) and Abstracts Views on Vision4Press platform.
Data correspond to usage on the plateform after 2015. The current usage metrics is available 48-96 hours after online publication and is updated daily on week days.
Initial download of the metrics may take a while.