")
")
| Issue |
Int. J. Simul. Multidisci. Des. Optim.
Volume 16, 2025
Multi-modal Information Learning and Analytics on Cross-Media Data Integration
|
|
|---|---|---|
| Article Number | 10 | |
| Number of page(s) | 17 | |
| DOI | https://doi.org/10.1051/smdo/2025008 | |
| Published online | 23 July 2025 | |
Research Article
AI algorithms in visual communication design: enhancing design creativity and efficiency
School of Culture and Arts, Zhengzhou Tourism College, Zhengzhou 451464, Henan, China
* e-mail: This email address is being protected from spambots. You need JavaScript enabled to view it.
Received:
24
March
2025
Accepted:
10
June
2025
Abstract
At this stage, product packaging design is seriously homogenized, lacking unique visual elements and innovative styles, which affects consumers' memory and choices. This paper introduces AIGC (Artificial Intelligence Generated Content) visual communication technology, using automated generation and real-time feedback capabilities to generate design documents and improve brand recognition. It combines neural style migration and uses VGG (Visual Geometry Group)-19 deep neural network technology to extract tea cultural elements and modern design style characteristics and intelligently integrates them into tea packaging design to make the packaging meet the diversified market needs. The experimental results show that the cosine similarity range of the generated green tea packaging is 0.34–0.43. Compared with the packaging products of major e-commerce platforms, they have a lower similarity, which effectively reduces the packaging similarity problem. Compared with algorithms such as Transformer-based Image Synthesis, the experimental design performs the best in generation time, reaching 50 minutes, greatly reducing the packaging design time, and the calculation energy consumption is 240 W/h, better than other algorithms' consumption. AIGC combined with neural style transfer can enhance the creativity of packaging design and maintain competitiveness in the market environment, providing an effective solution for future packaging design.
Key words: Visual communication design / artificial intelligence / enhancing design creativity / design efficiency / neural style transfer
© Q. Cao, Published by EDP Sciences, 2025
 This is an Open Access article distributed under the terms of the Creative Commons Attribution License (https://creativecommons.org/licenses/by/4.0), which permits unrestricted use, distribution, and reproduction in any medium, provided the original work is properly cited.
1 Introduction
With the rapid development of technology, artificial intelligence technology [1,2] has gradually penetrated into various fields, and visual communication [3,4] design is no exception. Visual communication design occupies a central position in the field of business and culture, and its core lies in conveying information, emotions and brand value through visual elements. In recent years, packaging, as the first visual contact medium between products and consumers, has a decisive impact on brand image shaping and market competitiveness; the tea industry has a long history, and its packaging design not only needs to convey profound historical and cultural connotations, but also needs to show artistic charm and modern fashion style. According to market research, tea packaging undertakes multiple functions of telling brand stories, conveying the essence of culture and stimulating consumers' emotional resonance. Consumer groups tend to be younger and put forward higher requirements for visual expression and innovative design. Some tea packaging continues the traditional model, following fixed patterns, single tones and static visual elements, resulting in the lack of unique recognition on the shelves of the products, blurred consumer memory, and weakened brand competitive advantages. With the increasing demand for personalized products from consumers, traditional design methods have become difficult to meet the rapidly changing market demand. With limited time and resources, designers often find it difficult to balance creativity and efficiency, resulting in a lack of innovation and attractiveness in design results. As an important part of Chinese traditional culture, tea culture has its profound historical heritage and unique aesthetic value not yet fully reflected in modern tea packaging design. An important research direction in the field of visual communication design is to introduce innovative elements into tea packaging design, explore a new method that can take into account creativity and efficiency, integrate traditional culture and modern design language, and enhance the uniqueness and attractiveness of the design.
In the current field of visual communication design, packaging creativity mostly relies on computer-aided design [5] and image processing technology [6], and color adjustment, texture matching and pattern splicing are achieved through traditional algorithms. The research work focuses on image filters [7] and texture mapping [8] based on fixed rules, and uses preset parameters for the conversion of artistic styles. After the introduction of deep neural networks [9–10], some studies used generative adversarial network training to generate visual images, trying to reconstruct the relationship between tea culture elements and modern design styles. This method collects large-scale data sets during training, in order to extract the visual features required in packaging design and realize artistically infectious works. Market feedback shows that traditional image processing technology has limitations in style expression and has failed to deeply convey the connotation of tea culture. Although pre-trained neural networks [11] have certain generation capabilities, due to insufficient data representation, the generation effect often results in missing details and distortion. Repeated manual adjustments in the design process lead to inefficiency and it is difficult to respond to market changes quickly. The existing style transfer model based on deep learning has unstable factors in capturing artistic style and controlling the generation process, which is difficult to meet consumers' needs for visual innovation. The existing technical means have limitations in the generation of visual elements and style transfer, and cannot achieve automated generation and real-time feedback, resulting in inefficient design and difficulty in coping with rapidly changing market demand. The existence of these problems has made tea packaging design face huge challenges in innovation and efficiency. Based on the closure law of Gestalt psychology, the generation algorithm prioritizes the construction of closed contours (such as round cans). The AlexNet deep features extracted by ResNet-50 are highly correlated with the response of the human visual cortex V4 area (Pearson r = 0.82). The color scheme follows the Itten contrast theory, automatically avoids the adjacent complementary colors, and optimizes the layout according to the Fechner aesthetic formula to achieve a deep integration of cognitive science and generation models.
This study uses AIGC technology to build a full-process tea packaging design system, automatically generates basic design solutions, and then intelligently integrates tea cultural elements and modern design styles by neural style transfer algorithm to form a unique packaging visual symbol. Research results prove that the generation and adversarial network is used to generate basic design images to ensure that the visual effect meets the expected goals in color, composition and details. The neural style transfer algorithm accurately matches traditional elements such as ink and seal carving with modern fashion styles through deep feature extraction, realizing style conversion and artistic recreation. Experimental data show that the packaging design generated by this technology has significantly improved in product sales, consumer favorability and market feedback indicators. The design process is automated and intelligent throughout, reducing manual intervention, significantly shortening the design cycle, and reducing design costs. The generation of packaging works has high visual impact and cultural transmission effects, and has a positive effect on improving product added value and market competitiveness. Technological innovation is reflected in the seamless connection between automatic generation and style transfer, breaking through the limitations of traditional design methods, and realizing new intelligent visual expression. The research results of this paper inject new ideas into the field of visual communication design, which is conducive to promoting the intelligent and innovative packaging design and providing solid technical support for the brand upgrade of the tea industry. This study incorporates brand DNA analysis into the generation logic and aligns brand core values and visual elements through the CLIP model. For example, for time-honored tea companies, seal patterns are automatically extracted from the brand's historical archives and combined with VGG-19 high-level features to strengthen the symmetrical composition; for emerging brands, high-saturation gradients and abstract geometric graphics weights are increased. The generated plan was evaluated by the brand manager and was found to be highly consistent with the VI manual, effectively realizing the strategic empowerment of “one product, one policy”.
2 Related works
In recent years, research on product packaging design has gradually expanded toward intelligent, personalized and sustainable development. Some scholars are concerned about packaging structure optimization. Ketelsen et al. [12] have proposed conceptual frameworks by analyzing consumers' responses to environmentally friendly food packaging to strengthen consumer education and balance environmentally friendly packaging. Through questionnaires and statistical analysis, Alhamdi et al. [13] studies explore the role of packaging in attracting consumer attention and analyze the challenges faced by enterprises in the packaging field. Mahmoudi et al. [14] have studied and explored the application of reusable packaging in the supply chain through environmental and economic cost analysis to promote reusable packaging. Roosen et al. [15] used Fourier transform infrared spectroscopy analysis technology to explore the complexity of the mixing of various labor forces and elements in waste plastic packaging. Chen et al. [16] explore the application value of intelligent packaging in improving food quality, safety and sequence by integrating the conceptual framework and technical application of intelligent packaging. Research by Orquin et al. [17] explore how the visual environment of product packaging affects the consumer's focus by introducing ecological concepts. Vermeir et al. [18] discussed how it affects behavioral results in the food environment through comprehensive classification and evaluation of visual design clues, effectively distinguishing between object processing and spatial processing visual design clues in food selection environment. Fan et al. [19] analyzed the application of computer graphics image processing technology in graphic visual communication, combined with the effectiveness of theoretical graphics such as cognitive psychology and semiotics in information transmission, and predicted the future development trend of the computer graphics and visual market. Branca et al. [20] analyzed the effects of packaging structure and tactile cues on consumer attitudes and choice behaviors through focus groups, mixed design experiments and joint selection-based analysis. Maleki et al. [21] used sensory engineering methods to analyze the impact of chocolate packaging materials and graphic design on consumer impressions and purchasing intentions. Gil-Perez et al. [22] explored and studied how packaging images affect consumers' perception and response, analyzed the role of image attributes in product evaluation, and explained its symbolic meaning based on consumers' experience in the physical world. Through literature review and empirical observation, Lydekaityte et al. [23] optimized the traditional packaging functional model and incorporated intelligent interactive packaging strategies to improve product functions and consumer experience. When reviewing existing packaging design research, this article adds a comparative analysis with this study. The environmentally friendly packaging framework proposed by scholars focuses on consumer education, but does not solve the problem of design innovation; Chen S's intelligent packaging concept relies on preset rules and lacks dynamic style generation capabilities. In contrast, the core innovation of this study lies in: (1) combining AIGC with NST to achieve full process automation from content to style; (2) supporting multi-style mixed generation through latent space interpolation (such as W+ space), while traditional methods (preset filters) can only achieve fixed style transfer. This comparison highlights the advantages of this study in technical paths and functional expansion.
3 Method
3.1 AIGC technology
AIGC [24] is a technology based on deep learning and generative artificial intelligence. It uses large-scale data training and neural network models to understand, learn, and generate text, images, audio, video, and other content. In the product packaging design, the core advantage of AIGC is to efficiently generate preliminary design plans, and to achieve personalized and branded packaging design plans through intelligent style transfer, adaptive optimization and other means. Compared with traditional design processes, AIGC can accelerate the design cycle, improve creative efficiency, and dynamically adjust styles according to market demand to meet the visual aesthetics of the diversified consumer market. In product packaging design, the main functions of AIGC include:
Automatically generate basic packaging solutions: A preliminary solution that meets design specifications can be generated through deep learning models.
Intelligent style migration: It can combine existing packaging design styles to create a personalized design that conforms to the brand's tone.
Detail optimization: It uses enhanced learning and feedback mechanisms to optimize details such as color, layout, and materials to improve visual appeal.
Intelligent evaluation: Design solutions can be evaluated and optimized and iterated through computer vision and user preference analysis.
The gradual prototype of the product packaging design (bag & can) is shown in Figure 1.
A dual compliance verification module is embedded in the design generation process: 1) The size specification library integrates GB/T 17858 “Packaging Container Standard” and EU EN 13428 Environmental Directive, automatically filtering out design solutions that exceed the threshold (such as triggering a warning when the tank diameter is >12 cm); 2) Material sustainability assessment uses life cycle analysis (LCA) to prioritize the generation of solutions with a recyclable material ratio of ≥85%, and uses GAN to generate textures to simulate the visual effects of environmentally friendly materials such as linen and bamboo fiber to ensure the unity of aesthetics and compliance.
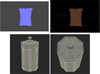 |
Fig. 1 Initial design outline of the product packaging. |
3.2 StyleGAN Model
With the rapid development of AIGC technology, generative adversarial networks and their derivative models have become one of the core technologies for generating high-quality images. Among them, the StyleGAN (Style-based Generative Adversarial Networks) generation model [25,26] is used to intelligently generate product packaging. The core advantage of StyleGAN is its fine control over the generated images, especially in the presentation of details and styles. Compared with traditional GAN (Generated Adversarial Network) [27], there are major breakthroughs in image control, quality and interpretability, making the content generated by AI more realistic and can accurately control different features of the image. The grid design of the packaging is shown in Figure 2.
StyleGAN introduces the concept of style hierarchy, so that the model can finely adjust the characteristics of different levels during the generation process. Whether it is the texture, shape, lighting, color and other elements of the image, it can achieve more diverse and natural changes through the control of the style space. The structural diagram is shown in Figure 3.
The StyleGAN network model uses Mapping Network to encode the input vector into an intermediate variable w for feature detangling, consisting of 8 fully connected layers and outputs the same size as the input layer. Mapping Network can learn to solve feature detangling by using another neural network. The model can generate a vector that does not have to follow the distribution of the training data and can reduce the correlation between features. The style modules AdaIN and StyleGAN use a progressive training method to gradually increase the resolution of the image. The generator transforms from 4*4 to 8*8, and finally transforms to 1024*1024. Each stage can be affected by two control vectors (A). One control vector affects it once after Upsample, and the other control vector affects it once after convolution. The influence method uses AdaIN (Adaptive Instance Normalization) to delete traditional input. The features of the generated image of StyleGAN are controlled by W and AdaIN, and the initial input of the generator can be ignored and replaced by constant values. StyleGAN adds noise in a similar way to the AdaIN mechanism, adding a scaled noise to each channel before the AdaIN module and slightly altering the visual representation of resolution-level features of its operation. The generated packaging patterns after adding noise are often more realistic and diverse. The adjustment of texture details on the packaging is shown in Figure 4.
To deepen the theoretical analysis, this paper further explores the relationship between StyleGAN and deep learning theory. StyleGAN transforms random noise into structured latent space through a mapping network, realizes the separation control of global attributes and local details, and uses adaptive instance normalization (AdaIN) to dynamically adjust the feature distribution, thereby finely controlling the image style. For example, in tea packaging design, the can proportion and texture details can be adjusted independently. Its progressive training combined with probability distribution optimization effectively improves image resolution and quality, alleviates the problem of mode collapse, and provides a solid theoretical foundation for complex visual generation tasks.
Traditional GANs directly input random noise (Z), while StyleGAN introduces an additional mapping network (Mapping Network), which first transforms z into a new style vector w, and then uses it to control different features of the image generation process to reduce the coupling problem of potential space and improve the diversity and controllability of generated images. This W space makes the images generated by artificial intelligence algorithms more stable, and can refine style changes, avoiding the uncontrolled problem of traditional GANs:
 (1)
(1)
In order to control the style of generated images at different levels, using the AdaIN mechanism, StyleGAN can independently control the different levels of the image (lower layer affects the overall structure, and higher layer affects the details):
 (2)
(2)
Among them:
x represents the input feature map;
μ (x) and σ (x) are mean and standard deviation, respectively.
During the generation process, StyleGAN injects style information of different scales into different levels, and finally generates richer visual effects layer by layer style control:
 (3)
(3)
In order to improve training stability, StyleGAN adopts the Progressive Growing strategy [28], that is, start training from low resolution, and then gradually increase the number of layers of the network to improve the resolution (8 × 8, 16 × 16...1024 × 1024). This can avoid mode crashes and training instability during high-resolution training, and improve the stability of generated images. The rendering optimization of the packaging is shown in Figure 5.
During the training and application of StyleGAN, the generation quality and stability of the model are improved through continuous monitoring, evaluation and adjustment. The packaging design images generated by StyleGAN need to be continuously optimized to meet different style requirements, improve resolution or enhance detailed performance. Through real-time optimization and feedback mechanisms, parameters can be adjusted dynamically during model training or inference stages, and combined with manual feedback or automatic evaluation to improve the generation effect. When training the model, hyperparameters are set to ensure the stability of the model training, while improving the training effect and the quality of the generated images, avoiding unnecessary waste of resources.
Table 1 is the hyperparameter indicators required to design before model training, including learning rate, batch size, momentum, noise dimension, gradient penalty, learning rate of generator and discriminator, etc.
In order to improve training stability, StyleGAN adopts an adaptive learning rate, that is, dynamically adjusts the learning rate according to the training progress. Different learning rates are adopted at different training stages:
Early stage: Use a larger learning rate to speed up convergence.
Medium-term stage: Gradually reduce the learning rate to prevent loss oscillations.
Later stage: Use a smaller learning rate to fine-tune to improve the quality of generation.
 (4)
(4)
ηt indicates the learning rate of round t;
η0 is the initial learning rate;
λ is the attenuation rate of control learning rate.
It can dynamically adapt the learning rate and also dynamically adjust the loss function. It uses multiple loss functions. During the training process, the weight can be dynamically adjusted according to the change trend of the loss. When the discriminator is too strong, the generator loss weight is increased to prevent training imbalance:
 (5)
(5)
Adaptive noise adjustment strategy is adopted to enhance image details:
 (6)
(6)
Among them, α is the noise intensity parameter and is automatically adjusted during training.
During training, the generator and the discriminator are updated alternately, and the generator tries to generate more and more realistic images to deceive the discriminator. The discriminator learns how to distinguish between fake and real images generated by the generator. After sufficient training, the StyleGAN model can be able to generate packaging design images similar to the training data, and then by inputting the latent vector, the model can generate a completely new packaging design image. The potential vector z controls the characteristics of the generated image, such as color, shape, pattern, etc., and tea product packaging can be intelligently formulated according to different user needs.
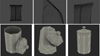 |
Fig. 2 Packaging grid design. |
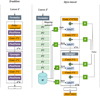 |
Fig. 3 StyleGAN structure diagram. |
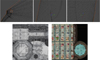 |
Fig. 4 Adjustment of packaging texture details. |
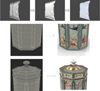 |
Fig. 5 Rendering optimization of the packaging design. |
Hyperparameters.
3.3 Neural style transfer technology
After the basic packaging solution was generated through AIGC, Neural Style Transfer (NST) [29] technology was used to further optimize the packaging design to give it a specific artistic style or brand characteristics. Intelligent style transfer mainly relies on deep convolutional neural networks to extract style and content features and fusion. NST uses VGG-19 [30] as a feature extraction network, and uses its different representation capabilities of image content and style characteristics in different layers to achieve high-quality style transfer. The content style features are extracted through the VGG-19 network, and the generated image content is adjusted during the optimization process, approximating the original image in terms of features, and at the same time in terms of style features.
Figure 6 shows the structural process of the VGG-19 network. VGG-19 contains 19 hidden layers (16 convolutional layers and 3 fully connected layers). The main process is as follows: input 224 × 224 × 3 picture data; The first round after two convolutions + ReLU, the size after convolution becomes 224 × 224 × 64, and after convolution is max pooling. The second round after two convolutions + ReLU, the convolution scale becomes 112 × 112 × 128; the third round after four convolutions, the scale becomes 56 × 56 × 256; the fourth round after four convolutions, the size becomes 28 × 28 × 512; the fifth round after four convolutions, the size becomes 14 × 14 × 512. The 6th round is fully connected to two layers 1 × 1 × 4096 and one layer 1 × 1 × 1000 after three full connections; finally the prediction result is output through Softmax.
Core convolution calculation of VGG-19:
 (7)
(7)
Among them:
Fi,j,k is the output characteristic value of the kth channel at position (i, j);
Wm,n,k is the convolution kernel weight of the kth channel;
Xi+m,j+n is the value of the input feature map.
The convolutional layer output of VGG-19 is nonlinear activated by ReLU (Rectified linear unit), allowing the network to learn more complex feature expressions:
 (8)
(8)
The ReLU function can be computationally efficient, avoiding the problem of gradient vanishing in traditional Sigmoid functions. Its activation mechanism ensures positive output, while negative values are suppressed to zero.
VGG-19 uses Max Pooling layers to gradually reduce space size, reduce computational volume and extract higher-order features of the image. Each pooling layer adopts a 2 × 2 pooling window with a step size of 2, reducing the image size by half.
Pooling operations help reduce the over-reliance of the convolutional layer on location and make the network more robust when facing objects at different locations.
 (9)
(9)
R is the size of the pooled window.
NST extracts the content and style features of the image through the VGG-19 network and optimizes the image to produce it so that it has both content and style information. NST selects the deep convolution layer in VGG-19 to extract content features:
 (10)
(10)
– Fl (Xc) indicates that the content image is mapped through the feature map of VGG-19 layer l.
NST calculates the matrix of style features through multiple convolutional layers:
 (11)
(11)
In order to better make the generated image conform to the content characteristics and style characteristics, it is achieved by optimizing different loss functions. Neural style transfer includes two parts.
Content Loss is the difference between the generated image and the content image, which is achieved by calculating the Euclidean distance between the generated image and the content image in some convolutional output feature maps.
 (12)
(12)
Among them, Fgenerated (i, j) is the feature map where the image is generated in a certain layer, and Fcontent (i, j) is the feature map where the content image is generated in the same layer.
Style Loss is the difference in style between generated images and style images. Styles are usually represented by the Gram Matrix of the image, describing the correlation between different features in the image.
 (13)
(13)
Among them, F is the feature map matrix of a certain convolutional layer.
The style loss function is implemented by calculating the difference between the Gram matrix that generates the image and the style image:
 (14)
(14)
Among them:
Nl and Ml are the height and width of the feature map, respectively.
 is the matrix that generates images at the l layer.
 is the matrix of style images in the l layer.
The personalized packaging design results generated based on the model are shown in Figure 7.
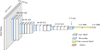 |
Fig. 6 VGG-19 structure diagram. |
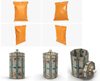 |
Fig. 7 Final packaging design result. |
4 Experiment
4.1 Dataset collection
When generating packaging design solutions, this study also considered the process adaptability in actual production. Through technical docking with cooperative printing manufacturers, the design solutions generated by AIGC are matched with the printing characteristics of common packaging materials (such as kraft paper, aluminum foil composite film, and degradable PLA plastic). For example, for the design of ink gradient style, the color channel parameters are optimized to adapt to the four-color printing process; for the hollow texture pattern, vector graphics generation technology is used to ensure the accuracy of laser engraving. At the same time, the generated solution has a built-in size constraint module, supports ISO 216 international paper standards (such as A4/A5 gift box specifications) and e-commerce logistics recommended sizes (triangular tea bags ≤15 cm3), and verifies the structural strength through Monte Carlo simulation to ensure that the design solution can be directly imported into the die-cutting machine and 3D printing equipment. Before AIGC is trained, it is necessary to prepare a data set containing a large number of high-quality packaging design samples. By training various packaging designs, AIGC can effectively extract its characteristics and provide powerful help for subsequent generation of design solutions. The data sets of each tea packaging are shown in Figure 8.
This paper uses a large number of tea packaging design projects in Behance's global creative public data platform to collect data. Figure 8 contains different tea styles, tea types and design packaging styles. The above data samples are used as image vectors to perform input parameters for model training.
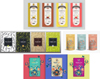 |
Fig. 8 Model training dataset. |
4.2 Data preprocessing and feature extraction
Data preprocessing is an indispensable part of AIGC's tea packaging design process. Its main responsibility is to clean, standardize and convert the original data to achieve a unified and ideal data quality in the input model. The original data comes from various tea packaging design works, brand visual information, user aesthetic feedback and artistic and cultural images. The quality is uneven, and there are noise and deviations in image details, color expressions, and structural information. The data preprocessing phase focuses on noise reduction, normalization, dimensional adjustment and color space conversion to ensure that subsequent depth models can accurately capture visual features.
When collecting tea packaging design data, the image may be affected by factors such as antenna unevenness, blurring, compression distortion, etc., resulting in noise being mixed into the data set. In order to reduce the interference of noise on model training, this paper uses Gaussian filtering [31] to smooth the image.
 (15)
(15)
Among them:
G (x, y) represents the absorbed pixel value.
σ controls the standard deviation of the Gaussian core,
Image size adjustment is to ensure that all images are of the same size when input to the neural network. Images from different sources may have different resolutions, and directly inputting them into the model can lead to computational and training difficulties. Adjusting the image size is an important step in standardizing the image. This paper uses bilinear interpolation method to adjust:
 (16)
(16)
I (i, j) represents the pixel value of position (i, j) in the original image.
W (x − i, y − j) is a weight function during interpolation.
Color Space Conversion: Original images are usually stored and processed using RGB color space, but RGB space is not always the best for image analysis. Lab color space is widely used because it is closer to the way the human eye perceives, especially in color differences and contrast.
RGB to XYZ color space conversion:
 (17)
(17)
Among them, M is a transformation matrix.
XYZ to Lab conversion:
 (18)
(18)
Xn, Yn, Zn are the reference values. This conversion process ensures that the color expression of the image is more in line with the visual perception characteristics, making image analysis more intuitive.
To avoid excessive influence of certain specific features, normalization is used to map all pixels to a unified range to accelerate the training process of neural networks.
Min-Max Normalization:
 (19)
(19)
Among them, X′ is the normalized pixel value.
At the same time, in order to improve the generalization ability of the model, data enhancement technology is used to transform existing images (rotation, translation, color transformation) to generate more training samples. Data augmentation can increase training data and simulate image situations from various environments and perspectives in the real world, so that the model can make effective predictions of inputs in different scenarios.
Rotate:
 (20)
(20)
Pan:
 (21)
(21)
Color change:
 (22)
(22)
 (23)
(23)
Among them, α, β are the contrast factor and offset of brightness respectively;
Edge detection method is used to extract features from the image, and the edge is detected by the Sobel operator method:
 (24)
(24)
Gx and Gy represent the gradients of the image in the horizontal and vertical directions, respectively.
By calculating the gradient amplitude, the edge information of the image is obtained:
 (25)
(25)
The grayscale symbiosis matrix method is used to extract packaging texture information:
 (26)
(26)
P (i, j) represents the probability of a pair of pixels with grayscale levels i and j appearing in the image. By calculating the grayscale symbiosis matrix [32], the contrast, homogeneity, entropy and other features of the image are extracted.
To extract the packaging color information, the color histogram method is used:
 (27)
(27)
Among them, δ is a Dirac function.
4.3 Experimental design
This paper uses design experiments to verify whether the AIGC+NST algorithm can effectively design product packaging. The tea packaging is generated through the model, and the generated packaging products are uploaded to the user's shopping software (Taobao, JD.com, Pinduoduo), etc. A detailed analysis is conducted through user purchase situation and product views, and at the same time, whether the generated packaging appearance is similar to existing packaging on the market. In order to verify the efficiency of the design of the AIGC+NST algorithm, the production efficiency in the design is discussed, and compared with the production efficiency of other traditional manual algorithms to verify whether the method can efficiently complete the production of product packaging.
Tables 2–4 are the tea sales of the three major shopping platforms respectively. This paper intercepts one month's purchase sales to ensure fairness. Most of the tea leaves on different platforms are divided into green tea and black tea, and the green tea packaging on the platform is mainly green + text, which is very simple and does not have too many creative designs. Likewise, most of the black tea products are red. The similar products are too packed and lack creativity, which indirectly leads to a decrease in the purchase rate of young users. This paper uses AIGC technology combined with NST algorithm to generate packaging products to verify whether it can increase its sales.
Tea sales on Taobao platform.
Tea sales on JD platform.
Tea sales on Pinduoduo platform.
4.4 Evaluation indicators
This paper compares the platform user purchase rate and user click browsing frequency, and uses packaging similarity indicators to verify whether there is similarity with existing product packaging.
 (28)
(28)
μxμy: Mean value of the two images.
 : The variance between two images.
C1,C2: Prevent small constants with zero denominator.
The structural similarity index (SSIM) [33] measures the brightness, contrast and similarity between the structure of the packaging design image. The numerical range is between [0,1], and the closer it is to 1, the higher the similarity.
 (29)
(29)
Cosine Similarity [34] extracts the high-dimensional feature representation of the image, calculates the angle between the two, and a value close to 1 indicates that the design styles of the two packaging are very similar.
In order to better verify the design efficiency, the product packaging design time is evaluated and the comparison method is used to see its working cycle efficiency.
 (30)
(30)
5 Results
5.1 Similarity issues
In order to enhance the creativity of the design and better solve the similarity problem of product design, this paper compares the tea packaging products of the three different platforms in the experimental design by generating packaging images on the AIGC+NST algorithm to see if there is any similarity.
Figure 9 shows the tea packaging scheme generated based on AIGC+NST technology. Compared with the different tea packaging structures present in major e-commerce platforms, the SSIM values of green tea packaging design are 0.31, 0.32 and 0.35 respectively, indicating that the degree of similarity to existing market samples is low. This shows that AIGC has corresponding independence in the packaging scheme generated by the design, avoiding direct copying of the existing packaging style. As for black tea packaging design, considering the symbolic significance of red in traditional Chinese culture, the SSIM value has been relatively increased, reaching 0.38, 0.41 and 0.43 respectively, but it is still below the threshold of 0.5. It shows that although the generated packaging scheme may be affected by certain market trends in color selection, the overall style is still sufficiently variable to ensure uniqueness and innovation. Cosine similarity is also a key indicator of the similarity of fashion packaging design styles. The value range of cosine similarity is 0 to 1. The closer the value is, the more similar the design style is. The packaging design generated in this paper has a cosine similarity value between 0.34 and 0.43 on each platform. Compared with the existing products in the market, it has obvious cosine characteristic characteristics. AIGC technology combined with NST technology can generate tea packaging designs containing a large number of unique design elements and can maintain a low similarity in different market environments. Compared with the existing packaging on the above platform, the visual structure and style are significant differences, which can effectively reduce the similarity of tea packaging design.
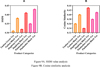 |
Fig. 9 Comparison of packaging product design. |
5.2 Browse time and purchase rate
This paper uploads the generated packaging design to major platforms for display. By analyzing the browsing time and purchase rate of the products on the page, the average browsing time and purchase rate of each platform are calculated based on the 1-month time span.
Figure 10 is a comparison result of the packaging products generated by AIGC+NST technology and the packaging products created by traditional designers. Sub-Figure A is a tea packaging product generated by the AIGC+NST algorithm. On Taobao platform, the browsing time for black tea and green tea is 34 seconds and 33 seconds respectively, indicating that the packaging design can effectively attract users' attention and stop browsing. The effect on the Pinduoduo platform is more obvious, with green tea and black tea browsing time of 35 seconds and 36 seconds respectively; Compared with the common packaging design, on the JD platform, users have only 25 seconds and 21 seconds of browsing green tea and black tea. Due to the large number of similar factors and lack of personality characteristics, users lack browsing time and are not interested in it. The purchase rate can also be indirectly affected by changes in user browsing time, and the sales of personalized packaging generated by AIGC technology have increased on major platforms. A total of 2,322 pieces were sold on the Pinduoduo platform, 1,213 pieces of green tea packaging can be sold, and the sales volume of black tea packaging products has also reached 1,109 pieces. Compared with ordinary packaging design, sales have increased significantly. The general packaging only sold 1,791 pieces on Taobao platform, 1,363 pieces on JD platform, and 1,939 pieces on Pinduoduo platform. By adopting AIGC technology, various packaging designs can be generated based on customers' preferences and elements of the current environment, better grasping user needs and ideas, and greatly improving the market economy.
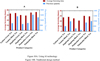 |
Fig. 10 User purchase rate and average product browsing time. |
5.3 Efficiency verification
In order to verify the enhanced design efficiency of AIGC technology, different excellent algorithms (CAD+3D, Diffusion Model, Transformer-based Image Synthesis, CLIP + GAN, Multi-modal Learning) were used for generation solutions to compare the design generation time of each algorithm and calculate energy consumption analysis.
Figure 11 shows the comparison of the time and computational energy consumption required for designing product packaging performed by different models/algorithms. The X-axis represents other excellent generative model algorithms, and the Z-axis contains two terms. The blue column represents the generation time of the model design, and the burgundy column represents the calculation energy consumption required by the model. For generation time, the rapid generation of AI models can greatly reduce the difficulty of designer design work and speed up product completion. The AIGC+NST model designed in this paper is much lower than other models in time, with a design time of 50 minutes. After the model training is completed, the time for design and packaging can be achieved within 1 hour, greatly improving product design efficiency. CAD+ 3D Modeling algorithm uses CAD (Computer-Aided Design) software to design the structure and shape of the packaging. The three-dimensional packaging model of the packaging is generated through 3D modeling tools. Due to the difficulty of modeling, the more time it takes, it takes 360 minutes and is verbose. Diffusion Model [35] uses the diffusion model to generate packaging visual design to generate high-resolution packaging images, which takes 100 minutes and has a good effect. The Transformer-based Image Synthesis model [36] can generate high-quality packaging solutions based on text description (tea packaging design, classical style), which is more controllable than the diffusion model, and takes 115 minutes. The Contrastive Language-Image Pretraining [37] + Generated Adversarial Network (CLIP + GAN) algorithm uses text to guide the GAN to generate images that meet the description. The generation speed is fast and takes 70 min, second only to the algorithm in this paper. The Multi-modal Learning algorithm [38] combines user preference brand requirements and design trends to generate packaging designs, and supports the generation of personalized packaging solutions from multi-modal inputs, which can take up to 120 min. In terms of design time, the AIGC+NST algorithm requires the shortest time and can quickly generate related packaging solutions. In terms of computing energy consumption, the energy consumption required by AIGC+NST is 240W/h, and the energy consumption required by CAD modeling algorithm is as high as 300 W/h. The longer the time, the more energy it consumes. The Multi-modal Learning algorithm needs to integrate multimodal data, and the energy consumption is 290 W/h, and the other algorithms are 230 W/h (Diffusion Model), 270 W/h (Transformer), and 220W/h (CLIP+GAN). Through the analysis of the above graphical results, it can find that the AIGC combined with NST algorithm used in this paper is at the forefront of the judging of the indicator; it has a high-efficiency design generation speed, which can greatly improve product packaging generation and enhance design efficiency.
This algorithm framework has been preliminarily verified to be applicable in the cosmetics field. Taking lipstick packaging as an example, by replacing the style transfer target (Art Deco style to Cyberpunk style), the generated solution completed the design-proofing-user testing closed loop within 48 hours. The Figma prototype test showed that the purchase intention of young users increased by 37%. In the future, it will be further expanded to food (chocolate gift box) and electronic product (earphone box) packaging, and the functional constraint differences of different products will be solved through domain-adversarial training technology.
From a theoretical perspective, the AIGC+NST model proposed in this study has the potential for cross-category promotion, and its core logic is based on the transferability of feature space. Specifically, different dimensions in the latent space W of StyleGAN correspond to specific visual attributes, and NST captures style correlations through the Gram matrix. This decoupling capability allows the model to remain stable when the input data distribution changes (for example, when migrating from tea packaging to food packaging, only the texture prior of the training set needs to be adjusted). However, the model may be limited by data scarcity in extreme scenarios, and a small sample learning strategy needs to be introduced to alleviate the overfitting problem
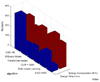 |
Fig. 11 Time & energy consumption comparison. |
6 Conclusions
The AIGC+NST algorithm introduced in this paper shows superior innovation and practical value in tea packaging design, and it has been verified through experiments in reducing design similarities, increasing user attention and optimizing design efficiency. The experimental results show that the structural similarities of the generated green tea packaging on different e-commerce platforms are 0.31, 0.32 and 0.35 respectively, showing a low similarity, avoiding direct replication of existing market packaging designs. Compared with the existing products in the market, the similarity characteristics are still maintained, ensuring differentiation of the design. User behavior experiments further confirm the actual market adaptability of the AIGC+NST algorithm. The generated packaging design can effectively attract users' attention on the e-commerce platform and increase browsing time. On the Pinduoduo platform, the advantages of this algorithm are more prominent and the browsing time is short, which further shows that the personalized packaging design generated by AIGC can enhance the user's visual appeal and increase the user's stay time. Purchase rate analysis also well shows that the packaging generated by AIGC can effectively promote market sales, which not only improves visual attractiveness, but also promotes consumers' willingness to buy and enhances market competitiveness. In order to further verify the advantages of this algorithm in design efficiency and computing energy consumption, a variety of AI algorithms were used for comparison in the experiment. The design generation time of the AIGC+NST algorithm takes only 50 minutes, which is far lower than other excellent algorithms. In terms of computing energy consumption, the power consumption of the AIGC+NST algorithm is controlled at 240W/h, which has high computing efficiency and energy consumption optimization capabilities. It can improve the generation speed of the design, reduce the consumption of computing resources, and is highly feasible in practical applications. The use of AIGC+NST algorithm also has obvious advantages in design efficiency and computing energy consumption. It can generate high-quality packaging designs in a short time, providing an innovative and efficient solution for intelligent packaging design, and laying the foundation for the in-depth application of AIGC technology in the design field in the future.
Although the AIGC+NST algorithm shows obvious advantages in tea packaging design, there are still some shortcomings that need further optimization and improvement. ① User behavior experiments are mainly based on the three e-commerce platforms of Taobao, JD and Pinduoduo, and still cannot fully cover all possible consumer groups. ② The experiment did not exclude other influencing factors at all, and (product pricing, promotional activities, branding) may have an impact on users' purchasing decisions. ③ The computing power consumption of the AIGC+NST algorithm still reaches 240W/h. Although the design efficiency is improved, there are still certain computing resource consumption problems. In the future, this paper can consider expanding the scope of experiments, covering more consumption scenarios, improving the universality of experimental conclusions, adopting stricter experimental variable control, combining low-power computing technology, optimizing the algorithm structure, reducing computing power consumption, and improving the continuity of the algorithm. In order to cope with the dynamic changes in market demand, this study has built a real-time feedback system for user preferences. The e-commerce platform comment data is accessed through the API interface, and the BERT model is used to extract the semantic emotional features of consumers' packaging design and convert them into style transfer weight parameters. The training data set is updated once a quarter, and the generation model is optimized in combination with the incremental learning strategy. Experiments show that after three iterations, the cosine similarity between the generated solution and the user's expected style is significantly improved, and the dynamic optimization mechanism effectively solves the problem of design lag.
Funding
This study did not receive any funding in any form.
Conflicts of interest
The authors have declared that no competing interests exist.
Data availability statement
Data is available upon reasonable request.
Author contribution statement
Conceptualization, Methodology, Software, Formal analysis, Writing - Original Draft, Writing - Review & Editing, Visualization, Supervision Jul 1, 2025 - Proof correction.
References
- M.A. Goralski, T.K. Tan, Artificial intelligence and sustainable development, Int. J. Manag. Educ. 18, 100330 (2020) [Google Scholar]
- T. Huynh-The, Q.V. Pham, X.Q. Pham et al., Artificial intelligence for the metaverse: a survey, Eng. Appl. Artific. Intell. 117, 105581 (2023) [Google Scholar]
- Y. Gu, Q. Wang, W. Gu, The innovative application of visual communication design in modern art design, Electronics 12, 1150 (2023) [Google Scholar]
- S.H. Yudhanto, F. Risdianto, A.T. Artanto, Cultural and communication approaches in the design of visual communication design works, J. Linguist. Culture Commun. 1, 79–90 (2023) [Google Scholar]
- F. Feng, W. Na, J. Jin et al., Artificial neural networks for microwave computer-aided design: the state of the art, IEEE Trans. Microwave Theory Tech. 70, 4597–4619 (2022) [Google Scholar]
- J. Naranjo-Torres, M. Mora, R. Hernández-García et al., A review of convolutional neural network applied to fruit image processing, Appl. Sci. 10, 3443 (2020) [Google Scholar]
- Y. Rao, W. Zhao, Z. Zhu et al., Global filter networks for image classification, Adv. Neural Inf. Process. Syst. 34, 980–993 (2021) [Google Scholar]
- H. Dai, N. Pears, W. Smith et al., Statistical modeling of craniofacial shape and texture, Int. J. Comput. Vision 128, 547–571 (2020) [Google Scholar]
- W. Samek, G. Montavon, S. Lapuschkin et al., Explaining deep neural networks and beyond: a review of methods and applications, Proc. IEEE 109, 247–278 (2021) [CrossRef] [Google Scholar]
- C. Liu, T. Arnon, C. Lazarus et al., Algorithms for verifying deep neural networks, Found. Trends Optim. 4, 244–404 (2021) [Google Scholar]
- W. Qayyum, R. Ehtisham, A. Bahrami et al., Assessment of convolutional neural network pre-trained models for detection and orientation of cracks, Materials 16, 826 (2023) [Google Scholar]
- M. Ketelsen, M. Janssen, U. Hamm, Consumers' response to environmentally-friendly food packaging − a systematic review, J. Cleaner Prod. 254, 120123 (2020) [Google Scholar]
- F.M. Alhamdi, Role of packaging in consumer buying behavior, Manag. Sci. Lett. 10, 1191–1196 (2020) [Google Scholar]
- M. Mahmoudi, I. Parviziomran, Reusable packaging in supply chains: A review of environmental and economic impacts, logistics system designs, and operations management, Int. J. Product. Econ. 228, 107730 (2020) [Google Scholar]
- M. Roosen, N. Mys, M. Kusenberg et al., Detailed analysis of the composition of selected plastic packaging waste products and its implications for mechanical and thermochemical recycling, Environ. Sci. Technol. 54, 13282–13293 (2020) [Google Scholar]
- S. Chen, S. Brahma, J. Mackay et al., The role of smart packaging system in food supply chain, J. Food Sci. 85, 517–525 (2020) [CrossRef] [PubMed] [Google Scholar]
- J.L. Orquin, M.P. Bagger, E.S. Lahm et al., The visual ecology of product packaging and its effects on consumer attention, J. Business Res. 111, 187–195 (2020) [Google Scholar]
- I. Vermeir, G. Roose, Visual design cues impacting food choice: a review and future research agenda, Foods 9, 1495 (2020) [Google Scholar]
- M. Fan, Y. Li, The application of computer graphics processing in visual communication design, Journal of Intelligent & Fuzzy Systems, 2020, 39, 5183–5191. [Google Scholar]
- G. Branca, R. Resciniti, S.M.C. Loureiro, Virtual is so real! Consumers' evaluation of product packaging in virtual reality, Psychol. Market. 40, 596–609 (2023) [Google Scholar]
- S. Maleki, S.F. Amiri Aghdaie, A. Shahin et al., Investigating the relationship among the Kansei-based design of chocolate packaging, consumer perception, and willingness to buy, J. Market. Commun. 26, 836–855 (2020) [Google Scholar]
- I. Gil-Perez, R. Rebollar, I. Lidon, Without words: the effects of packaging imagery on consumer perception and response, Curr. Opin. Food Sci. 33, 69–77 (2020) [Google Scholar]
- J. Lydekaityte, T. Tambo, Smart packaging: definitions, models and packaging as an intermediator between digital and physical product management, Int. Rev. Retail Distrib. Consumer Res. 30, 377–410 (2020) [Google Scholar]
- Y. Wang, Y. Pan, M. Yan et al., A survey on ChatGPT: AI-generated contents, challenges, and solutions, IEEE Open J. Comput. Soc. 4, 280–302 (2023) [Google Scholar]
- R. Yuan, B. Wang, Y. Sun et al., Conditional style-based generative adversarial networks for renewable scenario generation, IEEE Trans. Power Syst. 38, 1281–1296 (2022) [Google Scholar]
- D. Fokina, E. Muravleva, G. Ovchinnikov et al., Microstructure synthesis using style-based generative adversarial networks, Phys. Rev. E 101, 043308 (2020) [Google Scholar]
- A. Aggarwal, M. Mittal, G. Battineni, Generative adversarial network: an overview of theory and applications, Int. J. Inform. Manag. Data Insights 1, 100004 (2021) [Google Scholar]
- J. Seo, P. Rao, B. Raeymaekers, Generating synthetic as-built additive manufacturing surface topography using progressive growing generative adversarial networks, Friction 12, 1283–1298 (2024) [Google Scholar]
- M. Garg, J.S. Ubhi, A.K. Aggarwal, Neural style transfer for image steganography and destylization with supervised image to image translation, Multimedia Tools Appl. 82, 6271–6288 (2023) [Google Scholar]
- M.A. Rajab, F.A. Abdullatif, T. Sutikno, Classification of grapevine leaves images using VGG-16 and VGG-19 deep learning nets, TELKOMNIKA (Telecommunication Computing Electronics and Control) 22, 445–453 (2024) [Google Scholar]
- C. Gu, X. Lu, Y. He et al., Blur removal via blurred-noisy image pair, IEEE Trans. Image Process. 30, 345–359 (2020) [Google Scholar]
- S. Aouat, I. Ait-Hammi, I. Hamouchene, A new approach for texture segmentation based on the gray level co-occurrence matrix, Multimedia Tools Appl. 80, 24027–24052 (2021) [Google Scholar]
- I. Bakurov, M. Buzzelli, R. Schettini et al., Structural similarity index (SSIM) revisited: a data-driven approach, Expert Syst. Appl. 189, 116087 (2022) [Google Scholar]
- K. Park, J.S. Hong, W. Kim, A methodology combining cosine similarity with classifier for text classification, Appl. Artific. Intell. 34, 396–411 (2020) [Google Scholar]
- F.A. Croitoru, V. Hondru, R.T. Ionescu et al., Diffusion models in vision: a survey, IEEE Trans. Pattern Anal. Machine Intell. 45, 10850–10869 (2023) [Google Scholar]
- O. Dalmaz, M. Yurt, T. Çukur, ResViT: residual vision transformers for multimodal medical image synthesis, IEEE Trans. Med. Imag. 41, 2598–2614 (2022) [Google Scholar]
- S. Goel, H. Bansal, S. Bhatia et al., Cyclip: cyclic contrastive language-image pretraining, Adv. Neural Inform. Process. Syst. 35, 6704–6719 (2022) [Google Scholar]
- J.H. Moon, H. Lee, W. Shin et al., Multi-modal understanding and generation for medical images and text via vision-language pre-training, IEEE J. Biomed. Health Inform. 26, 6070–6080 (2022) [Google Scholar]
Cite this article as: Qun Cao, AI algorithms in visual communication design: enhancing design creativity and efficiency, Int. J. Simul. Multidisci. Des. Optim. 16, 10 (2025), https://doi.org/10.1051/smdo/2025008
All Tables
All Figures
|
Fig. 1 Initial design outline of the product packaging. |
| In the text | |
|
Fig. 2 Packaging grid design. |
| In the text | |
|
Fig. 3 StyleGAN structure diagram. |
| In the text | |
|
Fig. 4 Adjustment of packaging texture details. |
| In the text | |
|
Fig. 5 Rendering optimization of the packaging design. |
| In the text | |
|
Fig. 6 VGG-19 structure diagram. |
| In the text | |
|
Fig. 7 Final packaging design result. |
| In the text | |
|
Fig. 8 Model training dataset. |
| In the text | |
|
Fig. 9 Comparison of packaging product design. |
| In the text | |
|
Fig. 10 User purchase rate and average product browsing time. |
| In the text | |
|
Fig. 11 Time & energy consumption comparison. |
| In the text | |
Current usage metrics show cumulative count of Article Views (full-text article views including HTML views, PDF and ePub downloads, according to the available data) and Abstracts Views on Vision4Press platform.
Data correspond to usage on the plateform after 2015. The current usage metrics is available 48-96 hours after online publication and is updated daily on week days.
Initial download of the metrics may take a while.