")
")
| Issue |
Int. J. Simul. Multidisci. Des. Optim.
Volume 17, 2026
Multi-modal Information Learning and Analytics on Cross-Media Data Integration
|
|
|---|---|---|
| Article Number | 8 | |
| Number of page(s) | 18 | |
| DOI | https://doi.org/10.1051/smdo/2026007 | |
| Published online | 17 March 2026 | |
Research Article
Modeling and simulation optimization of interactive design systems based on artistic style transfer
1
School of Fashion and Art Design, Haojing College of Shaanxi University of Science and Technology, Xi’an 712000, Shaanxi, China
2
School of Economics and Trade, Haojing College of Shaanxi University of Science and Technology, Xi’an 712000, Shaanxi, China
* e-mail: This email address is being protected from spambots. You need JavaScript enabled to view it.
Received:
29
August
2025
Accepted:
15
February
2026
Abstract
This paper tackles key challenges in interactive design systems: high latency, weak user control, and the aesthetic-function trade-off. We propose an optimization method integrating lightweight generative networks with dynamic modeling. First, a feedforward network architecture based on the MobileNetV3 encoder and the AdaIN (Adaptive Instance Normalization) decoder is designed to achieve millisecond-level style transfer. Second, based on probabilistic state-space modeling theory, a human-machine collaborative state machine is constructed. This Markov decision process describes the transition probabilities of user operation sequences and integrates hard constraints such as readability and layout rationality. Then, a user-system co-simulation framework is proposed. A virtual user behavior simulator generates diverse interaction sequences, driving the NSGA-III (Non-dominated Sorting Genetic Algorithm III) algorithm to perform multi-objective optimization on style quality, response latency, and constraint satisfaction. Experimental results demonstrate significant improvements over baseline methods (AdaIN, WCT2) in the system's consistency of style expression, real-time interaction, and design usability. After 50 generations of optimization, the average FID (Fréchet Inception Distance) value drops from 20.4 to 13.5; the interaction latency decreases from 286 ms to 187 ms; and the constraint violation rate drops from 22.3% to 5.7%, a decrease of 16.6 percentage points, validating the effectiveness of the “modeling-simulation-optimization” methodology. This method achieves a closed-loop collaboration between art generation and engineering design, providing a modeling, simulation, and optimization solution for intelligent interactive design systems.
Key words: Interactive design system / artistic style transfer / lightweight generative network / human–machine collaborative state machine / multi-objective simulation optimization
© L. Yan et al., Published by EDP Sciences, 2026
 This is an Open Access article distributed under the terms of the Creative Commons Attribution License (https://creativecommons.org/licenses/by/4.0), which permits unrestricted use, distribution, and reproduction in any medium, provided the original work is properly cited.
1 Introduction
As digital design develops toward intelligence and personalization, interactive design systems are increasingly used in product appearance, interface layout, and visual expression [1]. Artistic style transfer technology has injected rich aesthetic generation capabilities into the design process, enabling the system to automatically integrate artistic features such as brushstrokes and color rhythm according to user intentions [2–3]. However, existing systems face multiple challenges in practical applications: the style generation process has a high computational load and is difficult to meet the response requirements of real-time interaction; users lack fine-grained control over the transfer results, resulting in the generation results deviating from the design intention [4]; the system behavior lacks theoretical support based on probabilistic state space modeling and cannot quantitatively describe the dynamic evolution process of user-system interaction; aesthetic expression often conflicts with functional constraints, such as overemphasizing visual style, which reduces interface readability; and existing optimization mechanisms mostly rely on static parameter settings and fail to achieve parameter adaptive adjustment through simulation-driven dynamic feedback loops. These problems limit the deep integration and continuous optimization of artistic generation technology in the engineering design process.
In recent years, artistic style transfer technology has shown great potential in the field of interactive design generation, injecting intelligent and personalized elements into the creative design process. Wang X et al. proposed an interactive multi-style art transfer system, which divided images into blocks through user interaction and selected different styles and algorithms for different regions and combined semantic parameter adjustment and color preservation functions to achieve a more refined stylized effect. At the same time, a subjective evaluation framework with the participation of art experts was constructed to guide the matching selection of styles and algorithms. The case verified the flexibility and practicality of the system [5]. Although these region’s segmentation-based methods have improved control accuracy, they have failed to solve the system modeling problem in real-time interaction. Guo J et al. explored the importance of user experience in the interactive design of smartphone theme interfaces and analyzed the limitations of traditional style transfer in mobile applications. Combining artificial intelligence and computer vision technology, they studied the application techniques of mainstream design styles such as flatness and skeuomorphism in mobile interfaces, aiming to improve user personalized experience and design innovation by optimizing interaction modes, interface layout, and information display methods [6]. Compared with interface design research, traditional craft fields have also benefited from the innovative application of style transfer technology. Wang T et al. proposed an innovative design method for rattan patterns based on a style transfer algorithm. They used ResNet to achieve pattern recognition and used CycleGAN (Cycle Generative Adversarial Network) to generate creative design solutions that conform to a specific style. Combined with the designer’s later adjustments, they achieved digital innovation and sustainable development of traditional rattan culture [7]. The field of clothing design has also actively adopted these technological advances, expanding the application boundaries of style transfer. Hu W et al. proposed a clothing style transfer method that combined AdaIN and CNN (Convolutional Neural Networks). Through efficient style adaptation and deep feature extraction, it achieved high-quality artistic pattern transfer while maintaining the structure of clothing. Combined with customized loss functions and diversified training data, the model could generate innovative designs with strong visual appeal, significantly expanding the boundaries of fashion creation and enhancing the democratization of design and the ability to integrate cross-art styles [8]. Breakthroughs in high-quality image generation technology have made it possible for more complex artistic expressions. Song G et al. proposed a high-quality portrait stylization framework based on inversion consistency transfer learning. By using a hierarchical variational autoencoder and a multi-resolution latent space, they generated high-quality artistic portraits with a resolution of 1024×1024 with only about 100 style samples and 1 hour of training. The method applied an attribute-aware generator and an early stopping strategy, which effectively improved the fidelity and generalization ability of style transfer, outperformed existing methods in various styles such as 3D cartoons and oil paintings, and supported image editing and action redirection applications [9]. Although these studies have made progress in generation quality, they generally lack a probabilistic graphical model description of system behavior and have not established a data coupling mechanism between the simulation environment and the optimization algorithm. The problem of connecting the technical chain of modeling–simulation–optimization has not been solved, resulting in a difficult dynamic balance between artistic generation and engineering constraints.
This paper constructs an interactive design system that integrates a lightweight dynamic style network with a human–machine collaborative state machine. A closed-loop optimization framework driven by probabilistic state space modeling and co-simulation is proposed. The human–machine collaborative model is constructed using an extended finite state machine and a Markov decision process. The dynamic characteristics of the design process are quantified using a state transition probability matrix and a reward function. Secondly, a lightweight feedforward generative architecture based on MobileNetV3 and AdaIN is designed as a differentiable simulator. This architecture maps user action sequences into style generation trajectories, providing a computable fitness evaluation environment for the NSGA-III algorithm. Finally, the virtual user behavior simulator generates interaction data streams that drive a multi-objective optimization algorithm to dynamically adjust network parameters and state transition strategies, forming a closed-loop technical chain: modeling (state space)–simulation (interaction sequence)–optimization (parameter update). This framework implements a complete chain from user input to style generation to system adaptive evolution, improving the controllability, consistency, and engineering applicability of the design process.
2 Architecture modeling of the interactive style design system
2.1 Lightweight dynamic style encoding-generation network
To achieve low-latency, high-quality artistic style transfer, a lightweight dynamic style encoding-generation network is constructed. The MobileNetV3-Large model, pre-trained on the ImageNet dataset, is used as the content encoder to extract multi-scale features of the input design sketch. In the encoder design, we select the feature maps from the 8th and 11th layers of MobileNetV3 as multi-scale content representations. The 8th-layer feature map (corresponding to an intermediate network depth) preserves richer spatial structure and detail information, which is crucial for controlling the injection of local styles. The 11th-layer feature map (from a deeper part of the network) captures more abstract semantic content, facilitating the unification of the overall style. Its depthwise separable convolutional structure significantly reduces the number of parameters and computational complexity [10–11]. The style encoder extracts the Gram matrix features of the style image based on the pre-trained VGG (Visual Geometry Group)-16, defined as:
 (1)
(1)
In Formula (1),  represents the ith channel of the kth layer style feature map; Ck×Hk×Wk is its dimension; and
 captures the correlation between channels as a statistical description of the style representation. The generator uses the AdaIN mechanism to align the content features Fc with the style features Fc [12–13]:
 (2)
(2)
In Formula (2), μ(⋅) and σ(⋅) represent the channel mean and standard deviation, respectively. An affine transformation is used to match the style of the content features to the statistical distribution of the style features. The network applies a learnable style strength control parameter α∈[0,1], which performs a weighted fusion of normalized features, enabling continuous user control of style strength.
 (3)
(3)
The decoder is composed of a series of upsampling blocks. Each block sequentially performs a 2× nearest neighbor upsampling, a 3×3 convolution, and a ReLU activation (except the last layer, which uses Tanh). This simple yet effective design, without using inverted MobileNetV3 blocks, ensures fast reconstruction while maintaining compatibility with the AdaIN-transformed features. The entire network is trained end-to-end, using a loss function comprised of a content loss and a style loss, ensuring that the generated output approximates the target style while preserving the content structure [14–15]. The total loss function is defined as

where  is the content loss, computed as the L2 norm between the VGG-16 feature maps φl of the content image Ic and the output image Io at layer relu3_3. The style loss
  is the Frobenius norm of the Gram matrix differences across multiple VGG-16 layers (relu1_2, relu2_2, relu3_3, relu4_3). The weighting coefficients are set to λc = 1 and λs = 1 × 10⁵ to balance the scale of the two terms.
As shown in Figure 1, the style transfer process interface shows the complete generation process from content sketch to stylized result.
Figure 1 illustrates the workflow of the lightweight dynamic style encoding-generation network: from content sketch input to style reference selection and finally generating a result with fused style features. By adjusting the style strength parameter α, users can achieve a continuous transition between content-driven and style-driven approaches. The slider at the bottom shows the gradient effect at different α values.
 |
Fig. 1 Style transfer process interface. |
2.2 Design of user-controllable style parameter adjustment interface
A user-controllable style parameter adjustment interface is designed, constructing a graphical user interface integrating multi-dimensional control variables. A style intensity slider control is implemented using the Qt framework, outputting a continuous variable α ∈ [0,1], with a precision of 0.01. This value is directly fed into the AdaIN fusion module of the generative network as an external input parameter to control the injection ratio of style features. The color adjustment module provides three-channel HSV (Hue Saturation Value) offset sliders, corresponding to ΔH, ΔS, and ΔV, respectively. The adjusted values are applied to the generated image after color space transformation [16–17]. The color space transformation function is
 (4)
(4)
In Formula (4),  represents the inverse transformation from HSV to RGB, and ΔS, ΔV ∈ [−0.5,0.5] prevent color distortion.
A canvas-based mask drawing function is developed. Users use a pressure-sensitive brush to generate a binary spatial mask M(x,y), which limits the style transfer application area. The final output is
 (5)
(5)
All parameters are bound to the real-time rendering module through the Qt framework. Parameter changes trigger asynchronous forward inference, and interface feedback latency is kept to within milliseconds, allowing users to dynamically adjust and instantly preview the generation process. To further mitigate visual lag during rapid slider adjustment, a real-time preview delay compensation mechanism is implemented. Within the Qt framework, an asynchronous rendering thread is embedded, dedicated to handling the style transfer inference. When a slider is dragged, the main UI thread immediately updates the slider’s value display. The rendering thread, however, employs a debouncing strategy: it waits for a short, fixed interval after the last slider movement before initiating the actual style transfer computation. This prevents the system from being overwhelmed by a high-frequency stream of requests. The result from this thread is then used to update the preview area. This approach decouples the responsive UI interaction from the computationally intensive generation task, effectively eliminating perceptible stutter and providing a smooth visual feedback experience for the user. The user-controllable GUI (Graphical User Interface) design in this paper is shown in Figure 2.
Figure 2 illustrates the interactive interface design supporting fine-grained style control. The central workspace is divided into a mask drawing area and a style preview area. The mask drawing area uses a semi-transparent blue overlay to visually display the editable area and supports the brush tool to define binary masks for local stylization. The control panel includes three core control components: the style intensity slider at the top controls the AdaIN feature fusion ratio; the HSV color adjustment area uses three-channel sliders to precisely shift ΔH ∈ [−180,180] and ΔS, ΔV ∈ [−0.5,0.5]; and the functional constraint status area displays the WCAG (Web Content Accessibility Guidelines) contrast ratio (5.2:1) and layout plausibility scores in real-time. The interface integrates a performance monitoring module, with latency and style quality indicators displayed at the bottom of the preview window. All controls are bound to a lightweight generation network via the Qt framework, ensuring that parameter changes trigger asynchronous inference and minimize interface feedback latency. This design enables precise user control of the style transfer process while ensuring design engineering applicability through constraint compliance indicators.
 |
Fig. 2 GUI interface design. |
2.3 Establishment of human–machine collaboration state transition models
A human–machine collaboration state transition model is established, using an enhanced finite state machine (E-FSM) to formally describe the design process [18–19]. The quintuple is defined as
 (6)
(6)
In Formula (6),  is the state set, corresponding to sketch input, style selection, local editing, confirmation generation, and revision rollback states, respectively; E is the event set, including user operations edraw (brush drawing), eselect (style selection), eadjust (parameter adjustment), and system response egen (style generation completion); and the transition function δ is defined by a conditional expression, such as δ(Ssketch, eselect)=Sstyle if and only if the sketch area fill rate ρ≥0.2, with
  , where Ω is the canvas area, and I(p) is the pixel value. The core state transitions governed by the function δ are formally defined in Table 1.
This ensures that once the sketch has a basic structure, the style selection stage is allowed to enter.
Compared to traditional Hidden Markov Models (HMMs), E-FSMs offer significant advantages in interactive system modeling: E-FSMs directly describe the design process logic through explicit state transition rules, while HMMs rely on probabilistic inference of implicit state sequences, making it difficult to intuitively reflect user operational intent. E-FSMs use deterministic conditional judgments for state transitions, while HMMs require the calculation of the likelihood of observation sequences, making them incapable of meeting real-time interaction requirements. E-FSMs can embed hard constraints, while HMMs can only indirectly influence state transitions through probabilistic soft constraints. However, when dealing with noisy inputs, the probabilistic modeling of HMMs improves robustness. For predicting unknown operation sequences, HMMs can automatically learn state transition rules using the Baum–Welch algorithm. While the current E-FSM effectively handles the deterministic core of the interaction, a promising direction for future work is a hybrid model. Such a model could leverage an HMM for probabilistic prediction of user intent to proactively pre-load resources, while the E-FSM would continue to manage the definitive state transitions and constraint enforcement, potentially offering a more robust and anticipatory system.
A state variable vector is applied to record real-time design parameters:
 (7)
(7)
The update rule is
 (8)
(8)
In Formula 8, Δv(e) is determined by the event type. To support efficient design backtracking with bounded memory usage, a fixed-capacity ring buffer structure is implemented instead of a conventional stack. The ring buffer has a predefined capacity of N, efficiently storing the state history:
 (9)
(9)
The parameter vector vi and timestamp ti corresponding to each state Si are recorded. The memory management strategy employs a pointer that circularly overwrites the oldest entry when the buffer is full, and a new state needs to be saved. This ensures constant memory consumption and prevents unbounded growth. For overflow handling, when a new state is pushed beyond the capacity N, it automatically overwrites the historically oldest state (s1, v1, t1). The backtracking operation is redefined as  , ensuring that users can trace back to any historical node, where the index is calculated modulo N, guaranteeing correct access to the kth most recent historical state even after overwrites. This optimization is crucial for the long-term stability of the closed-loop mechanism, preventing memory exhaustion during extended interaction sessions. The model constrains the rationality of the design process through state transition conditions, while retaining the complete operation trajectory, providing a computable behavior sequence for subsequent simulation optimization.
The abstract state machine model is visualized to clearly demonstrate how to capture and model user behavior. The user operation flow and state transition process interface are shown in Figure 3.
Figure 3 illustrates the workflow of the human–computer collaboration state machine: the top section shows the user operation event flow, the middle section shows the state transition model, and the bottom section shows an example of a typical user operation path. The state machine is implemented using an extended finite state machine. The state variable vector records design parameters in real time, supporting complete operation trajectory tracking and backtracking.
Extended finite state machine (E-FSM) state transition table.
 |
Fig. 3 User operation process and state transition diagram. |
2.4 Integration of the aesthetic-functional coupling constraint module
The aesthetic-functional coupling constraint module is integrated to embed computable engineering constraints into the generation process. A hard readability constraint function is defined as
 (10)
(10)
In Formula (10), Lfg and Lbg represent the relative brightness of the foreground and background, respectively. I(⋅) is an indicator function that ensures that the text area meets the WCAG 2.1 Level AA readability standard. Violations automatically trigger the color adjustment mechanism:
 (11)
(11)
A layout rationality scoring function is constructed:
 (12)
(12)
In Formula (12), wi represents the width of the ith design element; W represents the total canvas width; in this formula, φ represents the golden ratio (approximately 0.618); and N represents the total number of elements. This metric quantifies layout balance. When Qlayout < 0.7, the automatic rearrangement algorithm is initiated, using dynamic programming to minimize the element displacement cost  while maintaining Qlayout ≥ 0.75. In this scoring function, each element contributes equally to the final score, meaning the weight for each element’s deviation is uniformly set to 1/N. This equal weighting scheme avoids evaluation bias introduced by subjective experience, ensuring an objective and consistent assessment of layout balance based solely on the aggregate deviation from the golden ratio.
A constraint validation gate is set at the style transfer output layer. If the gate fails, the current generated result is frozen, and the constrained restoration submodule is activated. This submodule uses the gradient projection method to update the generated image:
 (13)
(13)
In Formula (13), C is the constraint feasible region; η = 0.01 is the step size; and Lstyle is the style loss, which ensures that the restoration process does not destroy the generated artistic features. All constraint calculations are executed in parallel on the GPU (Graphics Processing Unit), achieving real-time coordination between functional compliance and aesthetic expression. A comparative diagram of the constraint repair process is shown in Figure 4.
Figure 4 illustrates the workflow of the aesthetic-functionality coupling constraint module: On the left is a design result that violates WCAG readability (contrast ratio 4.2:1) and layout rules (spacing 6px); in the center is the constraint validation result, triggering the remediation mechanism; and on the right is the compliant result after the system automatically remediates (contrast ratio 4.8:1, spacing 10 px). The timeline at the bottom shows that the remediation process takes only 150 ms, meeting real-time interaction requirements.
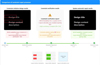 |
Fig. 4 Comparison of constraint repair processes. |
2.5 Modular system architecture framework construction
A modular system architecture framework is constructed, using a microservices architecture to decouple core functions into independently deployable units [20–21]. The overall modular system architecture design is shown in Figure 5.
Figure 5 shows the four-layer microservice architecture of the interactive design system and its data flow relationship. The user interaction layer includes a graphical user interface and an interaction management service, responsible for receiving sketch input, adjusting style parameters, and masking drawing instructions. The core processing layer consists of five service modules: a state machine service manages state transitions in the design process; a style generation service performs lightweight style transfer; a constraint verification service performs real-time WCAG readability and layout compliance checks; an optimization engine service dynamically adjusts parameters based on simulation results; and an interaction management service coordinates communication between modules. The data resource layer provides a style feature library, a constraint rule library, and performance monitoring data to support service decision-making. The infrastructure layer uses the Kafka message bus for inter-module communication and controls the end-to-end latency of the gRPC (google Remote Procedure Call) channel. The solid lines in the figure represent real-time data flows (such as style parameter updates), while the dashed lines represent configuration and monitoring data flows (such as resource allocation instructions). Through service decoupling and dynamic resource allocation, this architecture supports elastic scalability for multiple concurrent sessions, providing a computational system foundation for subsequent simulation optimization.
Each service communicates via a RESTful API (Representational State Transfer) and gRPC dual channel. Data streams with high real-time requirements are transmitted using gRPC persistent connections. The end-to-end latency is calculated as follows:
 (14)
(14)
In Formula (14), τproc is the serialization processing time; τnet is the network transmission latency; and τser is the service response time. To enhance communication reliability, the gRPC channel implements an error retry mechanism with an exponential backoff strategy. This mechanism automatically retries failed RPC calls for transient errors (e.g., network timeouts), with the delay between retries increasing exponentially up to a maximum number of attempts (e.g., 3). This ensures system robustness against temporary network fluctuations. A dynamic resource allocation mechanism based on Docker containers is established, and the number of service instances Ni is adjusted in real-time by a load monitor:
 (15)
(15)
In Formula (15), λi is the request arrival rate; Ti is the single request processing time; θi is the service throughput threshold; and ρmax is the maximum resource utilization rate to prevent service overload.
A unified data bus is designed to manage cross-module data flows and define the message structure:
 (16)
(16)
In Formula (16), t is the timestamp; s is the source module ID; d is the destination module ID; and p is the payload. Ordered message distribution and persistence are achieved through Kafka. A performance monitoring agent is deployed at the ingress gateway layer to calculate the system availability metric  in real-time. Automatic scaling policies are triggered when A < 0.95. The interfaces of each module strictly follow the specifications to ensure type safety and version compatibility of calls between services. The overall architecture supports dynamic expansion to 50 concurrent design sessions on the NVIDIA A100 server cluster, and the service discovery latency is controlled within milliseconds.
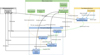 |
Fig. 5 Overall system architecture. |
3 System simulation environment and optimization process construction
3.1 Construction of virtual user behavior simulator
A virtual user behavior simulator is constructed to generate reproducible interaction sequences by formally modeling the operational patterns of real designers. The simulator’s design strictly adheres to the E-FSM state space and event set, ensuring simulation validity by covering the boundary conditions of state transition paths. Regarding state space traversal, the simulator forces each session to fully cycle through all states. Hardened test cases are designed specifically for critical conditions, and Monte Carlo sampling is used to generate boundary value operation sequences to verify the robustness of the state machine. The event-triggering mechanism strictly adheres to the conditional branches of the transition function. While ensuring a regular event flow, a 5% probability of low-probability events (such as fine-grained parameter adjustments) and a 10% probability of unusual concurrent events (such as style selection and drawing operations being triggered simultaneously) are specifically set to fully test the state machine’s fault tolerance.
Core behavioral characteristics are extracted based on eye tracking and operation log analysis of 30 professional designers during user interface design tasks. This data was specifically collected for this study through a controlled lab experiment where designers performed a series of interface design tasks using a prototype of our system. A third-order Markov chain is used to model the user operation sequence, and the state space is defined as {sketch input, style selection, parameter adjustment, mask drawing, result confirmation, task rollback}. The order of the Markov chain was quantitatively determined through A/B testing. We evaluated chains of order k = 1 to 4 by measuring their simulation fidelity (using the Kullback-Leibler divergence between real and simulated operation distributions) and the associated increase in computational latency. A third-order (k = 3) chain was selected as it achieved an optimal balance, improving fidelity by over 15% compared to a first-order model while incurring a negligible latency increase of less than 5 ms per simulation step. The transition probability matrix is obtained through the statistics of actual user operation data to ensure that the simulation behavior conforms to the timing characteristics of the design workflow [22]. The simulator has 10 typical user portraits built in, and each portrait has a differentiated behavior parameter distribution: exploratory users (accounting for 25%) frequently trigger state rollback through large-scale parameter adjustments; efficiency users (accounting for 30%) quickly lock the target style and minimize the editing steps; perfect users (accounting for 20%) continuously verify the local modification function through intensive mask editing; novice users (accounting for 15%) are hesitant in operation and often trigger rollback; and expert users (accounting for 10%) directly enter the advanced editing mode. Each user behavior generation process strictly follows the design task constraints, such as the stroke density distribution in the sketch drawing stage, the probability model of the dwell time in the style selection stage, and the step size randomness in the parameter adjustment stage. The characteristic parameters of five types of user portraits of the simulator are shown in Table 2.
Table 2 systematically defines the quantitative characteristics of the behavioral patterns of five typical user types during the interactive design process. Based on an analysis of actual operational data from 30 professional designers, the statistical characteristics of these user types across six key behavioral dimensions are presented. All data are presented as mean ± standard deviation, reflecting the natural fluctuations in user behavior. Table 1 provides a quantifiable parameter benchmark for the virtual user behavior simulator, enabling the simulation process to precisely simulate the operational habits of users with different design styles, addressing the overly idealized user behavior modeling problem in traditional research.
For constraint verification, the simulator proactively generates 20% of violation cases to monitor whether the system correctly executes constraint repairs and triggers state rollbacks. During the simulation, the current state and history stack of the state machine are monitored in real-time, dynamically adjusting the generation probability of uncovered paths. Ultimately, high state transition path coverage is achieved, providing high-fidelity behavioral input for NSGA-III optimization. The simulator injects an operational event stream into the interaction management service through the system’s Application Programming Interface (API), including fine-grained data such as mouse trajectory, keyboard input, and touch pressure, to fully simulate the entire process from task initiation to design completion. The simulator supports large-scale parallel operation. A single instance can simulate a complete design session within 10 s, providing high-fidelity behavioral input for subsequent multi-objective optimization. It solves the problems of small real-user experimental samples, high costs, and large fluctuations in results and it ensures the objectivity and repeatability of system evaluation.
User portrait characteristic parameters of the simulator.
3.2 Multi-objective evolutionary simulation optimization framework design
A multi-objective evolutionary simulation optimization framework is designed to establish a simulation-driven closed-loop optimization mechanism to improve the overall system performance. We frame the system tuning as a multidisciplinary optimization problem with three primary objectives: style deviation (minimized via FID), functional integrity (maximized via constraint satisfaction), and computational efficiency (minimized via interaction latency). The multi-objective optimization is formally defined as minimize [FID(I), Latency, Violation Rate], subject to system and user constraints. The framework adopts a three-layer architecture: a virtual user behavior simulator at the bottom layer, a performance metric collection module at the middle layer, and the NSGA-III multi-objective evolutionary optimizer at the top layer [23–24]. The simulator generates diverse operation sequences based on 10 defined user profiles. Each simulation round runs 100 design sessions, covering different combinations of style templates, content sketches, and constraints.
The performance metric collection module monitors five key dimensions in real-time: style quality, calculated by FID and the feature distance between the generated image and the target style; interaction latency, which records the end-to-end time from user operation to interface update; user satisfaction, derived from task completion rate and number of operation steps; design diversity, which measures the difference in LPIPS (learned perceptual image patch similarity) between different styles of output under the same content; and constraint violation rate. Performance metric definitions are shown in Table 3. The other metrics in Table 3 (user satisfaction, design diversity) are not optimization objectives but are used post-hoc for comprehensive system evaluation and analysis.
Table 3 defines the five performance metrics required for system optimization and their scientific measurement methods, detailing the specific calculation method, optimization direction, and objective weighting of each metric obtained through the entropy weighting method.
The optimizer encodes adjustable parameters such as the style intensity parameter α, color offsets ΔH, ΔS, and ΔV, and mask sensitivity threshold as decision variables, forming a multi-search space. A reference-point-guided NSGA-III algorithm is used for Pareto front search, with a population size of 150 and 50 evolutionary generations. During each generation of optimization, the system automatically configures parameter combinations and triggers simulation runs, feeding the collected performance metrics back to the evolutionary algorithm as fitness values. To accelerate convergence, an elite retention strategy and an adaptive crossover mutation operator are applied [25–26].
The optimization process utilizes a parallel computing architecture, using MPI (Message Passing Interface) to distribute tasks across nodes. A single generation of optimization takes less than 15 minutes. Convergence is determined when the rate of change of the hypervolume metric on the Pareto front for five consecutive generations is less than 1%, and the optimal parameter configuration set is output. This framework overcomes the limitations of traditional design systems that rely on manual parameter adjustment, achieving automated multi-objective trade-offs based on simulation feedback and providing a quantifiable performance improvement path for the system.
Multi-objective optimization performance metric definitions and measurement methods.
3.3 Implementing simulation-optimization closed-loop feedback mechanism
A simulation-optimization closed-loop feedback mechanism is implemented by establishing a dynamic control channel from performance evaluation to parameter adjustment. After each simulation round, the system automatically extracts the normalized values of five performance indicators, including FID-style quality score, end-to-end interaction latency, task completion rate, LPIPS diversity index, and constraint violation rate. The objective weights of each indicator are calculated using an improved entropy weight method that incorporates a time decay factor λ (set to 0.95). This factor dynamically reduces the influence of older performance data, ensuring that the weight allocation remains responsive to the most recent system state and optimization trends. [27–28].
Based on the Pareto optimal solution set output by the NSGA-III algorithm, the parameter configuration that best matches the current system state is selected, focusing on adjusting core parameters such as style strength, color offset, and mask sensitivity threshold. The parameter update process adopts a progressive strategy, setting a maximum change threshold to prevent sudden system state changes that can lead to user experience interruptions.
To ensure the stability of the optimization process, a historical parameter memory is applied to store the results of the last five optimization rounds. If performance fluctuations exceed 15% between two consecutive rounds, the system automatically reverts to the historically optimal configuration and readjusts the learning rate. This closed-loop mechanism, implemented through the optimization engine service within the microservices architecture and the configuration management center, uses an incremental configuration update strategy, hot-deploying only changed parameters to avoid interaction interruptions caused by service restarts. The system implements a dynamic feedback frequency regulator, initially performing parameter updates every five simulation rounds. If the performance metric change rate remains below 5% for three consecutive rounds, the frequency is automatically increased to every ten rounds, achieving a balance between exploration and exploitation.
All parameter changes are recorded in a version control database, allowing for timestamp-based backtracking of any historical configuration state. This closed-loop mechanism achieves millisecond-level parameter synchronization on an NVIDIA A100 server cluster, with single-time feedback latency kept to within milliseconds, ensuring that the optimization process and user interaction proceed in parallel without impacting the real-time experience. By continuously monitoring the hypervolume metric trends along the Pareto front, the system automatically identifies optimization saturation points and suspends unnecessary computing resource consumption, forming an efficient and stable adaptive optimization loop.
4 Results and discussion
4.1 Style transfer quality improvement
Style transfer quality is a core performance metric for interactive design systems, directly determining the aesthetic expression of the generated results. FID, an objective metric for assessing the similarity between the generated image and the target style distribution, can quantitatively reflect the effectiveness of style transfer algorithms. This section compares the FID performance of the proposed method with baseline methods across a variety of artistic styles, verifying the advantages of the lightweight dynamic style encoding-generation network in maintaining style consistency and highlighting the effectiveness of the simulation-optimization closed-loop mechanism in improving style quality. The comparison results are shown in Figure 6.
Figure 6 demonstrates the optimization results for style transfer quality. Sub-figure (a) compares the FID values of five methods across five artistic styles. The data shows that the proposed method achieves the lowest FID values across all styles. In the Van Gogh style, the FID value decreases from 17.9 in the initial configuration to 12.4, a 30.7% reduction; in the Abstract Expressionism style, the FID value decreases from 20.1 to 14.6, a 27.4% reduction. Compared with the three baseline methods (AdaIN, WCT2 (Whitening and Coloring Transform), and Fast Photo Style), the proposed method achieves generally lower FID values, with significant advantages in complex styles such as Monet and Picasso. The error bars show that the proposed method has a small standard deviation (1.3–1.9), indicating the high stability of the style transfer results. The results demonstrate that the optimized method achieves a significant improvement in style consistency.
Panel (b) of Figure 6 shows the dynamic trajectory of the NSGA-III optimization process, with the blue curve recording the change in average FID value with the number of optimization iterations. The average FID in the initial generation is 20.4, decreasing to 13.5 after 50 generations of evolution. The error band shows that the standard deviation gradually decreases during the optimization process, reflecting the stability and robustness of the solution set. The slope of the broken line is steep in the first 20 generations and then slows down in the last 20–40 generations, indicating that the algorithm rapidly explores the parameter space in the early stages and then enters a fine-tuning phase in the later stages. This result validates the effectiveness of the multi-objective evolutionary framework and proves that simulation-driven closed-loop optimization can continuously improve the quality of style transfer, ultimately obtaining the optimal parameter configuration on the Pareto front. Overall, Figure 6 not only intuitively demonstrates the significant advantage of the proposed method in style consistency but also reveals the dynamic characteristics of the optimization process, providing a quantitative basis for improving the performance of interactive design systems.
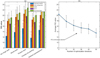 |
Fig. 6 Style transfer quality optimization results. (a) Comparison of FID values for each method. (b) Optimization process. |
4.2 Interaction response latency optimization results
Interaction response latency is a key factor affecting user experience, and real-time requirements pose a severe challenge to interactive design systems. This section analyzes the system response latency characteristics from four dimensions: method comparison, operation type, user profile, and optimization process. By precisely measuring end-to-end interaction time, the real-time performance of the system under different parameter configurations is evaluated, and the effectiveness of the multi-objective optimization framework in improving interaction fluency is verified. All latency benchmarks were measured on a system equipped with an NVIDIA A100 GPU and an Intel Xeon Platinum 8360Y CPU to provide a clear hardware baseline for the reported “millisecond-level” performance. The verification results are shown in Figure 7.
Figure 7 comprehensively reveals the effectiveness of multi-dimensional optimization of interaction response latency. Panel (a) of Figure 7 compares the average response latency of five methods. The optimized method achieves a latency of 187 ms, while the initial configuration achieves 286 ms. The data shows that the optimized method achieves a 34.6% reduction in average latency compared to the initial configuration, outperforming AdaIN and WCT2. While Fast Photo Style achieves the lowest latency, its task completion rate is only 63.2%, indicating that it sacrifices design quality for speed. Panel (b) of Figure 7 focuses on the latency distribution of four core operation types: data shows that parameter adjustment has the highest latency of 215 ms, yet still achieves a task completion rate of 92.7%, indicating that despite the time-consuming nature of this operation, user acceptance is high. Panel (c) of Figure 7 analyzes latency performance by user type. The data reveals that novice users experience the highest latency of 210 ms yet still achieve a task completion rate of 91.2%. Expert users, on the other hand, experience the lowest latency of 176 ms and the highest task completion rate. This reflects the differences in acceptance thresholds among users with different design experience levels and provides a basis for designing personalized interaction strategies. Panel (d) of Figure 7 depicts the NSGA-III optimization process: the average latency is 286 ms in the initial generation, which decreases to 187 ms after 50 generations, a 34.6% decrease. The error bands show that the standard deviation gradually decreases during the optimization process, reflecting improved solution stability. The slope of the broken line is steep in the first 20 generations and then slows down in the later stages, indicating that the algorithm rapidly explores the parameter space in the early stages and then enters a fine-tuning phase in the later stages. The task completion rate also increases from 78.5% to 94.3%, confirming the positive correlation between latency optimization and user experience.
Overall, the data shows that through simulation-driven closed-loop optimization, the system can achieve continuous latency reduction while maintaining task completion rate, ultimately obtaining the optimal parameter configuration on the Pareto front. This provides a quantitative basis for improving the real-time performance of interactive design systems and addresses the difficulties of manual parameter adjustment and lack of real-time performance in traditional methods.
Table 4 compares the differences between four core operation types with and without state machine prediction to verify response latency.
Table 4 illustrates how the state machine predicts the next state and pre-loads the style generation network weights, reducing the latency of the style selection operation from 203 ms to 167 ms. During the parameter adjustment phase, the state machine dynamically allocates GPU computing resources based on historical Markov chain predictions, reducing peak latency by 10.8%. Without prediction, unconventional paths increase latency due to the need to cold-start service instances. However, in the predictive mode, such operations are predicted by the state history stack. The results show that the E-FSM’s state prediction reduces the global mean end-to-end interaction latency by 14.3%, validating the core value of the state machine model in real-time optimization.
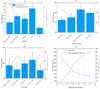 |
Fig. 7 Multi-dimensional response latency. (a) Latency comparison of different methods. (b) Latency comparison of different operation types. (c) Latency comparison of different user types. (d) Latency during optimization. |
Comparison of the optimization effect of state machine prediction on response latency.
4.3 User satisfaction simulation evaluation results
User satisfaction is the ultimate criterion for measuring the success of interactive design systems and requires a comprehensive evaluation from multiple dimensions. Based on data from 100 design sessions generated by a virtual user behavior simulator, this section systematically analyzes the impact of different approaches on user experience by combining objective indicators such as task completion rate, number of operation steps, and completion time with satisfaction scores, revealing the inherent correlation between parameter optimization and user satisfaction. The analysis results are shown in Figure 8.
Figure 8 shows the comprehensive performance of five methods across six user satisfaction dimensions. All data are normalized to a 0–100 scale. The optimized polygon area of the proposed method is significantly larger than that of the other methods, indicating the highest overall user satisfaction. Specifically, in the task completion rate dimension, the proposed method achieves a score of 88.6 after optimization, a 31.6-point improvement over the initial configuration, significantly outperforming the other methods. In the number of operation steps dimension, the proposed method achieves a standardized score of 83.3 after optimization, a 41.3-point improvement over the initial configuration, indicating a significant reduction in the number of interaction steps required to complete the task. In the task completion time dimension, the optimized standardized score reaches 67.8, a 30.5-point improvement over the initial configuration (37.3), approaching the 78.8 score of Fast Photo Style. However, the proposed method achieves a 62.2-point higher task completion rate than Fast Photo Style, demonstrating the proposed method’s superior balance between speed and quality. In the operation efficiency dimension, although Fast Photo Style scores the highest, the combination of the task completion rate metric suggests that its high efficiency comes at the expense of design quality. In terms of satisfaction rating, the optimized method achieves a standardized score of 77.5, a 22.5-point improvement over the initial configuration and the highest score among all methods. In terms of intention compliance, the optimized method achieves a standardized score of 75.0, a 30.4-point improvement, demonstrating a significant improvement in the system’s ability to understand and implement user design intent.
This result validates the effectiveness of the simulation-optimization closed-loop mechanism: by using the NSGA-III algorithm to find Pareto optimal solutions across multiple objectives, the system simultaneously optimizes interaction efficiency and design quality, ultimately achieving an overall improvement in user satisfaction. The overall trend in Figure 8 demonstrates that the proposed interactive design system, integrating a lightweight style network with a human-machine collaborative state machine, not only addresses the real-time nature of artistic style transfer but also creates a design experience that better meets user needs through multi-dimensional collaborative optimization.
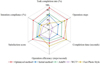 |
Fig. 8 Multi-dimensional evaluation of user satisfaction of different methods. |
4.4 Comparison of design diversity and quality
Design diversity is a key characteristic of artistic style transfer systems for maintaining creative expression, forming a complex trade-off with style quality. This section constructs a parameter space for style intensity and color shift, analyzes the synergistic variation between the LPIPS diversity index and the FID style quality, identifies the optimal parameter combination region, and verifies the system’s ability to maintain style consistency while maintaining design diversity. In the HSV color space, hue is an angle value ranging from 0° to 360°, and its corresponding color relationship is as follows: 0°/360° is red; 60° is yellow; 120° is green; 180° is cyan; and 240° is blue. This section focuses on the impact of hue shift ΔH, as it is most noticeable to the human eye. The analysis results are shown in Figure 9.
Figure 9 systematically reveals the synergistic influence of style strength and color shift on design diversity and style quality. Panel (a) of Figure 9 shows the distribution characteristics of the LPIPS design diversity index under different parameter combinations. The data shows that as the style strength α increases from 0.1 to 1.0, the LPIPS value shows a significant upward trend: under the condition of ΔH = 0°, the LPIPS value increases from 0.35 to 0.71, an increase of 102.9%. Furthermore, the effect of color shift ΔH on diversity shows a clear periodicity, with the LPIPS value peaking in the ΔH = ±60° region, reflecting the human eye’s sensitivity to medium-saturation hue changes.
Panel (b) of Figure 9 shows the style quality evaluation results. The data shows that the FID value decreases monotonically with increasing style strength α: under the condition of ΔH = 0°, the FID drops from 20.3 to 13.8, a decrease of 32.0%. This downward trend is most pronounced in the high α range, indicating that high style strength more effectively captures the statistical characteristics of the target style. Notably, the FID value exhibits a selective response to the color shift ΔH, with the lowest FID value at ΔH = ±180°, indicating that cyan hues have a higher degree of feature matching during style transfer. A comparison in Figure 9 reveals a key principle: LPIPS diversity and FID style quality are not mutually exclusive but rather exhibit a synergistic optimization trend: as α increases, the system generates more diverse design results while simultaneously improving style quality.
This synergistic optimization phenomenon stems from the dual mechanisms of the proposed method: first, high α values enhance the dominant role of style statistics in AdaIN feature fusion, making the generated results more closely aligned with the target style distribution; second, the residual structure of the lightweight generative network preserves the diverse expression capabilities of content features. Particularly noteworthy is that within the parameter range α ∈ [0.8,1] and ΔH ∈ [60°,120°], the system achieves Pareto-optimal performance with both high diversity (LPIPS ≥ 0.64) and high quality (FID ≤ 15.0), providing an ideal parameter configuration range for interactive design. This result validates the effectiveness of the multi-objective optimization framework: by exploring the parameter space through simulation, the system can identify the optimal operating point that satisfies user demands for design diversity while ensuring consistency in artistic style, resolving the inherent “diversity-quality” trade-off in traditional style transfer methods.
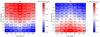 |
Fig. 9 Design diversity and quality evaluation under different style strength parameters. (a) LPIPS diversity index. (b) FID style quality. |
4.5 Functional constraint satisfaction verification
Functional constraint satisfaction is a key step in the transition of interactive design systems from artistic generation to engineering application, involving engineering standards such as readability and layout rationality. This section quantitatively evaluates the effectiveness of the aesthetic-functional coupling constraint module by tracking violations of WCAG readability and layout rules during the optimization process, verifying the system’s ability to dynamically balance artistic expression and engineering constraints. The verification results are shown in Figure 10.
Figure 10 shows the dynamic changes in functional constraint satisfaction during the optimization process. The constraint violation rate continuously decreases from 22.3% in the initial configuration to 5.7% in the 50th generation, a decrease of 16.6 percentage points, indicating that the system gradually improves its compliance with functional constraints during the optimization process. Specifically, the number of WCAG readability violations decreases from 18.7 to 4.6, and the number of layout rationality violations decreases from 15.6 to 5.1, both showing a steady downward trend. The three broken lines decrease rapidly in the first 30 generations and then flatten out after 30 generations, ultimately reaching convergence at the 50th generation. This change demonstrates that the aesthetic-functional coupled constraint module proposed in this paper can effectively reconcile the contradictions between artistic style generation and engineering specifications, significantly improving the usability and compliance of the design through a closed-loop simulation-optimization mechanism.
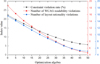 |
Fig. 10 Changes in functional constraint satisfaction during the optimization process. |
4.6 Multi-objective optimization Pareto front
The ultimate goal of multi-objective optimization is to obtain the optimal trade-off solution between style quality, interaction latency, and functional constraints. This section uses 3D Pareto front visualization and hypervolume metric analysis to evaluate the NSGA-III algorithm’s exploration capabilities in the objective space, identify optimal parameter configurations for different application scenarios, and verify the convergence and solution quality of the multi-objective evolutionary simulation optimization framework. The verification results are shown in Figure 11.
Figure 11 illustrates the entire multi-objective optimization process through 3D scatter plots and HV convergence curves. In the 3D plot on the left, the 15 Pareto optimal solutions are well distributed across the space of FID values, latency, and constraint violation rates, forming a clear frontier. Optimal solution 1 (FID = 11.8, latency = 215 ms) prioritizes style quality; optimal solution 2 (FID = 14.9, latency = 162 ms) prioritizes response speed; and optimal solution 3 (constraint violation rate = 3.1%) prioritizes functional compliance, demonstrating the trade-offs between multiple objectives. The HV convergence curve on the right shows that the hypervolume index continues to rise from an initial 0.312 to 0.796 at the 50th generation and stabilizes in the final 10 generations, indicating that the algorithm has converged. This change demonstrates that the NSGA-III algorithm successfully explores the three-dimensional target space and obtains a diverse and high-quality set of non-dominated solutions, validating the effectiveness of the multi-objective optimization framework.
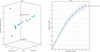 |
Fig. 11 Multi-objective optimization Pareto front solution set results. (a) 3D Pareto front scatter plots. (b) Hypervolume (HV) convergence curve. |
4.7 Ablation experiment analysis
To quantitatively evaluate the contributions of each core module proposed in this paper, we conducted systematic ablation experiments. These experiments were conducted on the same hardware platform (NVIDIA A100 GPU) and test set, comparing the performance of the following four configurations. The baseline model (Base) consists solely of the MobileNetV3 encoder and the basic AdaIN decoder, without semantic fusion and consistency optimization. Base + semantic fusion (Base+SF) adds a semantic fusion module based on the 8th and 11th layer feature maps to the baseline model. Base + consistency optimization (Base+CO) adds consistency optimization via the aesthetic-functional coupling constraint module to the baseline model. The full model (ours) includes all proposed modules, namely Base+SF+CO. We selected three core evaluation metrics: style quality (FID, lower is better), interaction latency (latency, lower is better), and constraint violation rate (lower is better). Each configuration was run five times independently, and the mean and standard deviation are reported. The results are shown in Figure 12 and Table 5.
Figure 12 and Table 5 reveal the following: Compared with the baseline model, the introduction of the semantic fusion module (Base+SF) significantly improves style quality (FID decreases from 17.2 to 15.1), demonstrating the importance of multi-scale feature fusion for enriching style expression. The introduction of the consistency optimization module (Base+CO) significantly reduces the constraint violation rate (from 21.5% to 7.8%), demonstrating its critical role in ensuring design feasibility. The complete model achieves an optimal balance between style quality and constraint satisfaction, achieving the lowest FID and constraint violation rate, demonstrating the effectiveness of the collaborative work of the modules.
This performance improvement comes at a moderate computational cost. From the baseline model to the complete model, the number of parameters increases by approximately 52%, and the inference latency increases by approximately 23%. This trade-off results in significant improvements in style consistency and functional compliance, which is reasonable and acceptable in the application scenario of interactive design systems. In summary, ablation experiments strongly confirm the effectiveness of the semantic fusion and consistency optimization modules proposed in this paper and the necessity of combining them into a complete system.
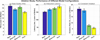 |
Fig. 12 Comparison of ablation test performance of different model configurations. |
Comparison of model complexity and runtime cost.
5 Conclusions
This paper proposes a modeling and simulation optimization method for interactive design systems based on a lightweight dynamic style encoding-generation network and a human-machine collaborative state machine. This method achieves closed-loop performance improvement by constructing a virtual user behavior simulator and a multi-objective evolutionary optimization framework. The system uses a MobileNetV3 encoder and an AdaIN decoder to achieve millisecond-level style transfer. A five-tuple state transition model is established to describe user action sequences. WCAG readability and layout rationality constraint modules are integrated to ensure design compliance. Experimental results demonstrate that this method achieves significant improvements in three key metrics: style transfer quality, interactive response latency, and functional constraint satisfaction. After 50 generations of optimization, the average FID value decreases from 20.4 to 13.5; the interaction latency decreases from 286 to 187 ms, a 34.6% reduction; and the constraint violation rate decreases from 22.3% to 5.7%, a 16.6 percentage point reduction. The innovation lies in achieving a dynamic balance between aesthetic generation and engineering constraints, thereby constructing a computable and optimizable formal model for interactive design systems. A primary limitation of this work is that the validation relies on a virtual user simulator. While this approach is cost-effective and enables large-scale optimization, the ultimate test of an interactive design system lies in its performance with real users. Therefore, a crucial direction for future work is to conduct a small-scale, qualitative user study to empirically validate the usability and aesthetic appeal of the generated designs with human participants. This research provides a complete technical path for intelligent interactive design systems that can be modeled, simulated, and optimized.
Limitations include the simulator’s approximation of real user behavior. Ethically, while this tool enhances creativity, it may impact design professions; we advocate for its use as an assistant rather than a replacement. And the proposed “modeling-simulation-optimization” framework exhibits strong potential for generalization beyond style transfer. It can be adapted to other simulation contexts such as architectural layout optimization, real-time rendering parameter tuning, and adaptive creative systems where user feedback loops and multi-objective trade-offs are central.
Funding
This research received no external funding.
Conflicts of interest
The authors have nothing to disclose.
Data availability statement
This article has no associated data generated and/or analyzed.
Author contribution statement
Conceptualization, L.Y., Q.Z., S.L. and R.L.; Methodology, L.Y.; Software, L.Y.; Validation, Q.Z., S.L. and R.L.; Formal Analysis, L.Y.; Investigation, R.L.; Resources, S.L.; Data Curation, S.L.; Writing – Original Draft Preparation, L.Y., Q.Z., S.L. and R.L.
References
- X Zheng, D Bassir, Y Yang, et al. Intelligent art: the fusion growth of artificial intelligence in art and design. Int. J. Simul. Multidiscip. Des. Optim. 13, 24 (2022) https://doi.org/10.1051/smdo/2022015 [Google Scholar]
- X Wang, W Wang, S Yang, et al. CLAST: contrastive learning for arbitrary style transfer, IEEE Trans. Image Process. 31, 6761–6772 (2022) https://doi.org/10.1109/TIP.2022.3215899 [Google Scholar]
- X Han, Y Wu, R Wan. A method for style transfer from artistic images based on depth extraction generative adversarial network, Appl. Sci. 13, 867 (2023) https://doi.org/10.3390/app13020867 [Google Scholar]
- A Zhou, X Wang, Y Huang, et al. Product image generation method based on morphological optimization and image style transfer, Appl. Sci. 15, 7330 (2025) https://doi.org/10.3390/app15137330 [Google Scholar]
- X Wang, Y Lyu, J Huang, et al. Interactive artistic multi-style transfer, Int. J. Comput. Intell. Syst. 14, 187 (2021) https://doi.org/10.1007/s44196-021-00021-0 [Google Scholar]
- J Guo, L Wang. Application of style transfer algorithm in interactive art design of mobile phone interface, Mob. Inf. Sys. 2022, 7469090 (2022) https://doi.org/10.1155/2022/7469090 [Google Scholar]
- T Wang, Z Ma, F Zhang, et al. Research on wickerwork patterns creative design and development based on style transfer technology, App. Sc. 13, 1553 (2023) https://doi.org/10.3390/app13031553 [Google Scholar]
- W Hu, Y Zhang. Research on artistic pattern generation for clothing design based on style transfer, J. Combin. Math. Combin. Comput 127, 4539–4550 (2025) https://doi.org/10.61091/jcmcc127b-248 [Google Scholar]
- G Song, L Luo, J Liu, et al. Agilegan: stylizing portraits by inversion-consistent transfer learning. ACM Transac. Graph. (TOG), 40, 1–13 (2021) https://doi.org/10.1145/3450626. 3459771 [Google Scholar]
- Z Jiao, H Dong, N Diao. Separable CenterNet detection network based on MobileNetV3—an optimization approach for small-object and occlusion issues, Mathematics 12, 2524 (2024) https://doi.org/10.3390/math12162524 [Google Scholar]
- L Zhao, L Wang. A new lightweight network based on MobileNetV3, KSII Transac. Internet Inf. Syst. 16, 1–16 (2022) https://doi.org/10.3837/tiis.2022.01.001 [Google Scholar]
- Q Zhu, H Bai, J Sun, et al. Lpadain: Light progressive attention adaptive instance normalization model for style transfer, Electronics 11, 2929 (2022) https://doi.org/10.3390/electronics11182929 [Google Scholar]
- Y Lyu, C L Lin, P H Lin, et al. The cognition of audience to artistic style transfer, Appl. Sci. 11, 3290 (2021) https://doi.org/10.3390/app11073290 [Google Scholar]
- X Xie, B Lv. Design of painting art style rendering system based on convolutional neural network, Sci. Program. 2021, 4708758 (2021) https://doi.org/10.1155/2021/4708758 [Google Scholar]
- Q Cai, X Zhang, W Xie. Art teaching innovation based on computer aided design and deep learning model, Comput. Aided Des. Appl. 21: 124–139 (2024) https://doi.org/10.14733/cadaps.2024.S14.124-139 [Google Scholar]
- M B Kösesoy, S Yılmaz. Deep learning based color and style transfer: a review and challenges, Int. J. Multidiscip. Stud. Innov. Technol. 8, 86–91 (2024) [Google Scholar]
- Z Dou, N Wang, B Li, et al. Dual color space guided sketch colorization, IEEE Transac. Image Process. 30, 7292–7304 (2021) https://doi.org/10.1109/TIP.2021.3104190 [Google Scholar]
- X Zhao, Y He, X Chen, et al. Human–robot collaborative assembly based on eye-hand and a finite state machine in a virtual environment, Appl. Sci. 11, 5754 (2021). https://doi.org/10.3390/app11125754 [Google Scholar]
- M Bdiwi, Naser I Al, J Halim, et al. Towards safety4. 0: a novel approach for flexible human-robot-interaction based on safety-related dynamic finite-state machine with multilayer operation modes, Front. Robot. AI, 9, 1002226 (2022) https://doi.org/10.3389/frobt.2022.1002226 [Google Scholar]
- G Blinowski, A Ojdowska, A Przybyłek. Monolithic vs. microservice architecture: a performance and scalability evaluation, IEEE Access 10, 20357–20374 (2022) https://doi.org/10.1109/ACCESS.2022.3152803 [Google Scholar]
- Y Zouani, M Lachgar. Zynerator: bridging model-driven architecture and microservices for enhanced software development, Electronics, 13, 2237 (2024) https://doi.org/10.3390/electronics13122237 [Google Scholar]
- R C Li. Joint modeling of user behaviors based on variable‐order additive Markov chain for POI recommendation, Wirel. Commun. Mob. Comput. 2021, 4359369 (2021) https://doi.org/10.1155/2021/4359369 [Google Scholar]
- H Zhang, G G Wang, J Dong, et al. Improved NSGA-III with second-order difference random strategy for dynamic multi-objective optimization, Processes 9, 911 (2021) https://doi.org/10.3390/pr9060911 [Google Scholar]
- S Sharma, V Kumar. A comprehensive review on multi-objective optimization techniques: past, present and future, Arch. Comput. Methods Eng. 29, 5605–5633 (2022) https://doi.org/10.1007/s11831-022-09778-9 [Google Scholar]
- L Wu, Z Li, W Ge, et al. An adaptive differential evolution algorithm with elite gaussian mutation and bare-bones strategy, Math. Biosci. Eng. 19, 8537–8553 (2022) https://doi.org/10.3934/mbe.2022396 [Google Scholar]
- X Wang, W Zhao, J N Tang, et al. Evolution algorithm with adaptive genetic operator and dynamic scoring mechanism for large-scale sparse many-objective optimization, Sci. Rep. 15, 9267 (2025) https://doi.org/10.1038/s41598-025-91245-z [Google Scholar]
- S Zhang, Y Mao, F Liu, et al. Multi-objective optimization and evaluation of PEMFC performance based on orthogonal experiment and entropy weight method, Energy Convers. Manag. 291, 117310 (2023) https://doi.org/10.1016/j.enconman.2023.117310 [Google Scholar]
- R M X Wu, Z Zhang, W Yan, et al. A comparative analysis of the principal component analysis and entropy weight methods to establish the indexing measurement, PloS One, 17, e0262261 (2022) https://doi.org/10.1371/journal.pone.0262261 [Google Scholar]
Cite this article as: Lifeng Yan, Qianyun Zhang, Sujun Li, Rongrong Liu, Modeling and simulation optimization of interactive design systems based on artistic style transfer, Int. J. Simul. Multidisci. Des. Optim. 17, 8 (2026), https://doi.org/10.1051/smdo/2026007
All Tables
Multi-objective optimization performance metric definitions and measurement methods.
Comparison of the optimization effect of state machine prediction on response latency.
All Figures
|
Fig. 1 Style transfer process interface. |
| In the text | |
|
Fig. 2 GUI interface design. |
| In the text | |
|
Fig. 3 User operation process and state transition diagram. |
| In the text | |
|
Fig. 4 Comparison of constraint repair processes. |
| In the text | |
|
Fig. 5 Overall system architecture. |
| In the text | |
|
Fig. 6 Style transfer quality optimization results. (a) Comparison of FID values for each method. (b) Optimization process. |
| In the text | |
|
Fig. 7 Multi-dimensional response latency. (a) Latency comparison of different methods. (b) Latency comparison of different operation types. (c) Latency comparison of different user types. (d) Latency during optimization. |
| In the text | |
|
Fig. 8 Multi-dimensional evaluation of user satisfaction of different methods. |
| In the text | |
|
Fig. 9 Design diversity and quality evaluation under different style strength parameters. (a) LPIPS diversity index. (b) FID style quality. |
| In the text | |
|
Fig. 10 Changes in functional constraint satisfaction during the optimization process. |
| In the text | |
|
Fig. 11 Multi-objective optimization Pareto front solution set results. (a) 3D Pareto front scatter plots. (b) Hypervolume (HV) convergence curve. |
| In the text | |
|
Fig. 12 Comparison of ablation test performance of different model configurations. |
| In the text | |
Current usage metrics show cumulative count of Article Views (full-text article views including HTML views, PDF and ePub downloads, according to the available data) and Abstracts Views on Vision4Press platform.
Data correspond to usage on the plateform after 2015. The current usage metrics is available 48-96 hours after online publication and is updated daily on week days.
Initial download of the metrics may take a while.