")
")
| Issue |
Int. J. Simul. Multidisci. Des. Optim.
Volume 17, 2026
Recent Advances in Hyperparameter Tuning for Machine Learning Models
|
|
|---|---|---|
| Article Number | 4 | |
| Number of page(s) | 11 | |
| DOI | https://doi.org/10.1051/smdo/2026002 | |
| Published online | 17 March 2026 | |
Research article
Utilizing force and displacement in unnatural index finger movements for authentication
1
Department of Biomedical Engineering, University of Isfahan, Iran
2
School of Information Engineering, Jiangxi University of Science and Technology, No 86, Hongqi Ave, Ganzhou, 341000, Jiangxi, PR China
3
Aix Marseille University, CNRS, Centrale Med, M2P2, Marseille, France
4
School of Engineering, Infrastructure and Sustainability, Faculty of Technology, Arts, Culture, De Montfort University, Leicester, LE1 9BH, UK
5
Department of Neurosciences, Biomedicine and Movement Sciences, University of Verona, Verona, Italy
* e-mail: This email address is being protected from spambots. You need JavaScript enabled to view it.
Received:
14
December
2025
Accepted:
7
January
2026
Abstract
The evolution of sensor technologies and real-time data processing has amplified the practicality of incorporating behavioral characteristics within security frameworks. Keystroke dynamics, in particular, has emerged as a prevalent behavioral biometric owing to the ubiquitous use of devices like mobile phones and computers, all reliant on password-based security systems. This study unveils an innovative authentication framework using leveraging deep learning algorithms, tapping into force and displacement data derived from the intricate abduction movements of the right index finger as a distinctive biometric trait. To ascertain its efficacy, we meticulously optimized this novel algorithm while benchmarking it against established deep learning models—Convolutional Neural Networks (CNNs), Gated Recurrent Unit (GRU), and Long Short-Term Memory (LSTM), and one-dimensional CNN (1D-CNN). The subsequent evaluation encompassed a comprehensive comparative analysis of their performance metrics. The findings of this evaluation are compelling, demonstrating an average F1 score of 75.5% in validation data alongside an impressive average accuracy rate of 99.4%. These outcomes unequivocally highlight the precision and reliability inherent in utilizing force and displacement patterns as behavioral biometrics. Equally noteworthy is the system's display of a remarkably low False Acceptance Rate (FAR) of 0.27%, positioning it as a promising contender for seamless integration within advanced security systems. In essence, this research not only showcases the potential of leveraging nuanced behavioral traits but also emphasizes the practicality and robustness of employing force and displacement patterns as precise indicators in the realm of behavioral biometrics for enhanced system authentication and security.
Key words: Biometric authentication / deep learning / biomechanical data / convolutional neural network
© F. Sharifi et al., Published by EDP Sciences, 2026
 This is an Open Access article distributed under the terms of the Creative Commons Attribution License (https://creativecommons.org/licenses/by/4.0), which permits unrestricted use, distribution, and reproduction in any medium, provided the original work is properly cited.
1 Introduction
Biometric systems represent automated methodologies designed to differentiate between individuals by leveraging their distinctive traits [1]. These systems operate within two operating modes: verification (or authentication) and identification (or recognition). Verification mode addresses the question: “Is the person claiming their identity genuine?” Conversely, identification mode seeks to answer: “Who is this individual?” or “Does this person exist within the database?” [2].
These systems are categorized not only by their operational modes but also by the number of biometric resources they employ, falling into either unimodal or multimodal systems. Unimodal systems rely on a single source of information, whereas multimodal systems integrate diverse resources, including various sensors, algorithms, data sets, and biometric characteristics, such as combining facial geometry with voice patterns. While unimodal systems are simpler and require less memory and execution time compared to multimodal ones, they are more susceptible to noise and attacks and tend to be less accurate [3].
Moreover, biometric models can be further classified based on the type of trait utilized—either physiological or behavioral mode. Physiological mode models rely on stable physical attributes of individuals to address the aforementioned inquiries [2]. Common examples encompass facial features, fingerprints, and iris patterns within this category [4]. Other physiological biometrics include DNA, finger veins, palm veins, retina scans, and hand geometry [5–7]. Recently, biomedical signals like ECG, EMG, PPG, and EEG have been employed as biometrics due to their authentication capabilities. These biometrics are also integrated into multimodal systems utilizing various bio signals to enhance accuracy and robustness against noise and attacks [8].
In contrast, behavioral mode models leverage human behavior or habits as unique identifiers [2], encompassing traits such as keystroke dynamics, gait patterns, signature variations, handwriting nuances, and voice characteristics [7]. While behavioral traits are readily collectible, their distinctiveness tends to be lower compared to most physiological biometrics [7]. Notably, voice or speech encompasses both behavioral attributes, like accent, and physiological characteristics, like vocal pitch [9].
Applied force represents a readily accessible form of data within the behavioral mode. Instances include opening a door by pressing a handle, typing via key presses, tapping on a mobile phone, applying force while walking, or exerting pressure on paper or a pen while writing or signing [10]. This study proposes exploring force and displacement as potential biometric markers. Subsequently, the reported results encompass the performance of various optimized deep learning models—Convolutional Neural Network (CNN), long short-term memory networks (LSTM), Gated Recurrent Units (GRU), and 1D-CNN—in both identification and verification modes.
The paper is structured as follows: Section 2 presents a review of previous works. Section 3 delineates the architecture of the proposed model in detail. Section 4 encapsulates a summary and analysis of the experimental outcomes. Finally, Section 5 discusses future research directions and offers concluding remarks.
2 Related works
2.1 Classical approaches
Keystroke dynamics have been extensively researched within the domain of behavioral biometrics. Researchers commonly extract features from keystroke latency [11,12], encompassing hold latency, inter-key latency, press latency, and release latency [13]. Additionally, finger pressure and area have emerged as notable features in keystroke dynamic studies [14].
In 2004, Nonaka and Kurihara [15] introduced pressure sensing as a novel feature extraction element to mitigate intrusions stemming from keyloggers and to accurately estimate keystroke timings. Later, in 2008, Leberknight and Widmeyer [16] proposed three pressure-related characteristics—amplitude or peak, peak area, and peak sharpness—to enhance classification accuracy based on keystroke latency. Similarly, Saevanee and Bhattarakosol [17], in the following year, explored keystroke pressure as a potential biometric, comparing its discriminatory potential to hold time and inter-key dynamics.
In 2013, Trojahn and Ortmeier [18] delved into touchpad pressure during typing, fingertip size during surface interaction, and user device handling information. Extracting these features from 18 users, various classifiers were employed. Additionally, Sulavko and Eremenko, in 2017 [19], investigated user authentication utilizing a specially sensor-equipped keyboard to capture keyboard pressure and keystroke temporal characteristics, utilizing wavelet parameters as features.
Krishnamoorthy and Rueda [20], in 2018, pursued a study enabling user access to computing devices based on keystroke dynamics, employing SVM and Random Forest methods. They incorporated touch pressure, average pressure of all keys, and other time-latency features as measurements. Moreover, Lee and Hwang [21] conducted a keystroke dynamics study in 2018 on 22 individuals using distance-based classifiers. Feature extraction involved time latency, touch size, and atmospheric pressure. Similarly, Wu and Ding [22], in the same year, studied typing latencies, hold times, and signal magnitude features with a two-factor classifier (verification and identification).
In 2019, Lee and Hwang [23] investigated keystroke dynamics, emphasizing feature extraction based on time latency, size, coordination, and movement. They introduced a novel feature selection method employing median, interquartile range (IQR), and classification through a distance-based classifier. Furthermore, in 2021, Alsuhibany and Almuqbil [24] undertook a study on Arabic keystroke dynamic pressure for user authentication. They extracted 13 features from raw data, encompassing time, acceleration, gyroscope, pressure, and coordination.
2.2 Deep learning approaches
Recent technological and scientific progress, characterized by enhanced access to deep neural network (DNN) training data and the widespread availability of high-performance GPUs, has significantly propelled the development of deep learning-based models in biometric recognition [25].
Philippe Terrier [26] explored the biometric potential of center-of-pressure (COP) trajectories obtained from 30 subjects during a 30 min treadmill walk. Employing CNN, the study achieved an impressive 99.9% accuracy in classifying gait segments.
Moon et al. [27] introduced a biometric model utilizing a combination of CNN and Recurrent neural network (RNN) specifically tailored for identifying individuals by analyzing gait information collected through a wearable insole device equipped with pressure sensors, accelerometers, and gyroscopes. Notably, this system demonstrated an identification accuracy surpassing 99% for 30 individuals.
Deb et al. [28] introduced a Siamese Long Short-Term Memory (LSTM) network architecture for passive user authentication, leveraging a dataset encompassing eight features from 37 smartphone users. These features included keystroke dynamics (key hold time, finger area, and finger pressure), GPS location, accelerometer, gyroscope, magnetometer, linear accelerometer, gravity, and rotation sensors. The study showcased accurate user verification, achieving 97.15% accuracy with a false accept rate of 0.1%.
Sun et al. [29] utilized a Support Vector Machine (SVM) and a Recurrent Neural Network (RNN) combination for smartphone user authentication, focusing on five features: coordinate average, moving distance, moving angle, curvature, and average pressure during interaction. Their approach achieved an accuracy of 93.9% with a False Acceptance Rate (FAR) of 7% across ten subjects.
Stragapede et al. [30] achieved an Equal Error Rate (EER) of 4.62% using a distinct Recurrent Neural Network (RNN) with triplet loss for keystroke recognition. They integrated touch data with information from 14 mobile sensors collected from 600 subjects using 179 device models during human-mobile interactions (HuMIdb). Stragapede and team introduced a biometric system combining LSTM and RNN architectures, achieving an AUC (Area Under the Curve) of 68.72% when tested on 81 individuals. Moreover, they introduced a CNN architecture utilizing features such as hold latency, inter-key latency, press latency, release latency, and the pressed key's values, achieving an EER of 3.84% [31]. These advancements were realized through a substantial dataset of 62,454 subjects typing sentences ranging from 3 words to 70 characters [32].
3 Material and methods
3.1 System overview
Data for this study was collected from the student population at the University of Verona similar to [33–37]. A cohort of 86 healthy participants (mean age: 21.6 ± 3.4 yr, without any reported health issues) engaged in the task of applying force to a piston using their index finger across 30 trials. Participants were instructed to exert force on a piston by performing abduction movements with their right index finger as rapidly and forcefully as possible. Force and displacement data were captured using a DS BC302 force transducer and a linear potentiometer. The recorded data were subsequently digitized using an analog-to-digital board (National Instruments, NI DAQ USB-6210), creating 200 samples at a sampling rate of 180 Hz, and stored in a PC. Subsequently, the stored data underwent filtration using a 100 Hz low pass and a 50 Hz notch filter, employing a zero-phase shift digital filtering process.
The proposed biometric identification system depicted in Figure 1 comprises two primary phases: the enrollment phase and the identification phase. During the enrollment phase, 70% of recorded signals from all users are utilized to train the network for subsequent use in the identification phase. In the subsequent phase, the remaining recorded signals are input into the trained network to ascertain users' identities, producing the system's output.
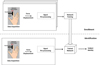 |
Fig. 1 Overview of the proposed biometric identification system based on force and displacement applied by the index finger. |
3.2 Preprocessing
Biometric systems frequently enforce specific constraints on input data to uphold operational efficiency and mitigate the impact of distorted records. Participant selection for user identification involved criteria where individuals were included based on the average intercorrelation threshold of their recorded force signals, set at 0.95 or higher, considering a recording error margin of 5%. The investigation specifically concentrates on evaluating force signals and their corresponding displacements, originating from identical starting points, as prospective biometric markers. Consequently, the proposed system relies on input data derived from 10 trials per individual ensuring the equal dataset of 86 users for comprehensive analysis.
3.3 1D -convolutional network architecture
Inspired by [38], the proposed model architecture comprises 11 layers, featuring two convolutional layers and two fully connected layers as depicted in Figure 2. Initially, the force and displacement signals are input into the first convolutional layer, utilizing a matrix format of 200 × 2, with a kernel size of 5 and 128 filters. With a stride set at 1, the input transforms into a 200 × 1 (1D) feature array. Given the employment of 128 kernels in the first layer, the resultant output adopts a size of 200 × 128. Subsequently, the feature maps undergo processing through a Gaussian Error Linear Unit (GELU) activation layer.
The second convolutional layer operates on an input matrix sized 200 × 128. Here, the kernel applied in the second convolutional layer employs a size of 3 and a doubled count of kernels compared to the first convolutional layer. Again, with a stride of 1, the convolution yields a feature map of 200 × 1 (1D). Leveraging 256 kernels, the output size of the second convolutional layer reaches 200 × 256. Post-convolution, the feature maps traverse an Exponential Linear Unit (ELU) activation layer.
Layer 6 represents a fully connected layer comprising 256 neurons, mirroring the count of kernels in the second convolutional layer. Subsequently, Layer 7 operates as a dropout layer, incorporating a dropout rate of 0.5. The resulting data, structured as 128 × 256, progresses to another fully connected layer comprising 86 neurons, matching the number of classes. This output, sized 86 × 256, is then routed through a SoftMax layer and a Global Average Pooling (GAP) layer, culminating in further classification for subject identification within the proposed system.
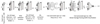 |
Fig. 2 The architecture of the proposed 1D-CNN algorithm. |
3.4 Training
During the training phase, 70% of recorded trials from each individual were randomly allocated for training the network, while the remaining 30% of data were reserved for evaluating the system's performance in the identification phase. The network underwent training optimization utilizing the Adam algorithm, concluding upon reaching 1000 epochs. The minibatch size equated to the number of kernels in the first convolutional layer, and the learning rate was set at 0.0006. Subsequently, this section encapsulates the tuning methodology, presenting a comparative analysis between the performance of the proposed deep learning architecture and other baseline methods, such as LSTM, GRU, and CNN.
4 Experimental results and analysis
This section conducts optimization of various deep learning algorithms using a 3-step feed-forward optimization process, followed by a comparative performance analysis. Multiple parameters are adjusted, encompassing feature sets, kernel parameters for CNNs, the quantity of hidden layers for LSTM and GRU models, and the learning rate. The objective is to minimize the False Acceptance Rate (FAR) and F1 score, critical evaluation parameters within security systems.
The initial step involves setting the learning rate, kernel size, number of kernels, and hidden layers to 0.006, 5, 256, and 100, respectively. This step aims to determine optimal feature sets among Force (F), Displacement (D), and their fusion (F, D). Subsequently, parameters for other deep learning architectures are fine-tuned, including kernel size selections from a range {2, 3, 5, 7}, kernel quantity within the range of {2n: n = 6, 7, 8, 9}, and hidden layer counts between 10 and 100.
It is important to highlight that the network undergoes training and testing 20 times for each set of parameters. The metrics obtained from these 20 iterations are examined to compare different parameter configurations. To ensure a more focused analysis, a subset of the mentioned ranges with the best results is reported. The figures depict the FAR and F1 score through boxplot figures. For clarity, the text includes the FAR and F1 score specifically for the identification phase.
4.1 Algorithm tuning
4.1.1 Parameter optimization in the CNN algorithm
The outcomes obtained from the feed-forward optimization performed across three distinct phases of the CNN algorithm are presented in Figure 3. The results pertaining to the identification phase are visualized in black, whereas those related to the validation phase are represented in red.
In the initial phase (Figs. 3a and 3b), the CNN algorithm underwent adjustments by initializing kernel size, number of kernels, and learning rate to values of 3, 256, and 0.0006, respectively. As shown in the boxplot, the Force feature exhibits superior discriminative potential compared to Displacement. This observation is supported by the validation phase metrics, where Force displays a slightly lower False Acceptance Rate (FAR) (0.1% less) and notably higher F1 score (10% higher) in contrast to Displacement. Moreover, the fusion of Force and Displacement features (F&D) enhances biometric characteristics, demonstrating the best results with the 0.31% FAR and 72.3% F1 score.
In Figures 3c and 3d, considering F&D as the feature and learning rate of 0.006, impact of varying CNN parameters is illustrated using notation (X, Y), with X denoting kernel size and Y indicating number of kernels. Notably, configurations such as (5, 128) and (3, 128) exhibit the lowest FAR (0.31%). However, the range and maximum value of (5, 128) are comparatively smaller than those of (3, 128). Therefore, optimal performance for the CNN algorithm is achieved using 128 kernels with a size of 5.
The final phase (Figs. 3e and 3f) involved training with different learning rates albeit with the kernel size of 5 and number of kernels of 128. Among the tested rates, a learning rate of 0.0008 is chosen, displaying an average F1 score close to 73%, a maximum F1 score exceeding 74%, and a FAR below 0.31%.
Hence, the optimized CNN algorithm configuration is defined as follows: utilizing Force and Displacement as the feature set, employing a kernel size of 5 with 128 kernels, and adopting a learning rate of 0.0008.
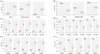 |
Fig. 3 CNN. (a) and (b) display boxplots presenting the FAR and F1 score for various features, namely Force, Displacement, and F&D, utilizing a kernel size of 3, 256 kernels, and a learning rate of 0.006. (c) and (d) showcase boxplots of FAR and F1 score, varying kernel sizes and kernel numbers while utilizing F&D as features and a learning rate of 0.008. It is worth noting that the horizontal axis denoted by (X, Y) signifies kernel size and the number of kernels, respectively. Lastly, (e) and (f) exhibit boxplots of FAR and F1 score concerning different learning rates, maintaining a kernel size of 5, 128 kernels, and utilizing F&D as the feature set. The boxplots are represented with a box having a horizontal line in the center, with horizontal lines extending from each side (referred to as “whiskers”). The box represents the interquartile range (IQR), encapsulating 50% of data points falling between the first quartile and the third quartile in the dataset. The outcomes corresponding to training and validation are distinguished by black and red colors, respectively. |
4.1.2 Parameter optimization in the LSTM Algorithm
Figure 4 presents a comprehensive analysis of LSTM algorithm performance across diverse experimental conditions. These conditions encompass variations in feature sets (Figs. 4a and 4b), adjustments in hidden layer numbers (Figs. 4c and 4c), and diverse learning rates (Figs. 4e and 4f), evaluated using metrics like FAR and F1 score. The outcomes concerning the identification phase are depicted in black, while those associated with the validation phase are shown in red.
In Figures 4a and 4b, where initial values for hidden layers (100), learning rate (0.0006), and minibatch size (128) were consistently set, the algorithm's behavior mirrors that of the CNN algorithm. Notably, the Force and Displacement diffusion-derived feature set (i.e., F&D) demonstrates promising biometric potential, yielding a FAR of approximately 0.39% and an F1 score of 65.9%.
Observing Figures 4c and 4d, in the case of F&D as the feature set, learning rate of 0.0006, and minibatch size of 128, a reverse correlation between hidden layer count and error rate is evident. As the number of hidden layers increases, the error rate decreases. However, this decline becomes insignificant after surpassing 60 hidden layers. Therefore, a configuration with 60 hidden layers is deemed optimal for the LSTM algorithm, resulting in a FAR of about 0.37% and an F1 score of 66.3%.
Figures 4e and 4f depict the algorithm's performance, considering F&D as the feature set, hidden layers of 60, and minibatch size of 128, during training with varying learning rates, evaluated by FAR and F1 score. Among the range of learning rate values, 0.001 stands out with an average F1 score exceeding 69%, and a FAR of 0.35%. Hence, the optimized LSTM algorithm is defined as follows: employing F&D as the feature set, setting the number of hidden layers to 60, and utilizing a learning rate of 0.001.
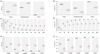 |
Fig. 4 LSTM. (a) and (b) display boxplots presenting the FAR and F1 score for various features, namely Force, Displacement, and F&D, utilizing the fixed number of hidden layers of 100, learning rate of 0.0006, and minibatch size of 128. (c) and (d) showcase boxplots of FAR and F1 score, presenting variations in the numbers of hidden layers maintaining F&D as the feature set, alongside a fixed learning rate of 0.0006, and minibatch size of 128. Finally, (e) and (f) exhibit boxplots demonstrating FAR and F1 score differences based on different learning rates, while keeping the number of hidden layers constant at 60 and utilizing F&D as the feature set. The boxplots are represented with a box having a horizontal line in the center, with horizontal lines extending from each side (referred to as “whiskers”). The box represents the interquartile range (IQR), encapsulating 50% of data points falling between the first quartile and the third quartile in the dataset. The outcomes corresponding to training and validation are distinguished by black and red colors, respectively. |
4.1.3 Parameter optimization in the GRU algorithm
The outcomes from the feed-forward optimization conducted through three distinct phases of the GRU algorithm are showcased in Figure 5. The results associated with the identification phase are depicted in black, while those concerning the validation phase are illustrated in red.
During the fine-tuning process of the GRU algorithm, the initial parameter values, i.e., number of hidden layers, mini-batch size, and learning rate, were configured to 100, 128, and 0.0006, respectively. Subsequently, the system's performance was assessed with the introduction of various feature sets (Figs. 5a and 5b). When solely employing Displacement as the input, the system displayed a higher error rate compared to using Force alone. However, merging these two features (i.e., F&D) amplified the system's performance, resulting in a reduction of the FAR to less than 0.39% and improving the F1 score to 64%. Hence, the fusion of the Force and Displacement (i.e., F&D) was chosen as the input.
Additionally, considering the F&D as the feature set, learning rate of o.0006, and minibatch size of 128, the algorithm's performance was scrutinized by varying the number of hidden layers within the range of 10 to 100, depicted in Figures 5c and 5d. It became evident that the number of hidden layers exhibited a consistent negative correlation with the system's error rate. However, beyond a threshold of 80 hidden layers, there was no significant reduction in the error rate. Consequently, the number of hidden layers was optimally set at 80, yielding a FAR close to 0.37% and an F1 score of 67%.
In the final tuning phase, as shown in Figures 5e and 5f, the algorithm's performance was evaluated for various learning rates with the fixed F&D as the feature set, number of hidden layers of 80, and minibatch size of 128. Among the tested rates, 0.001, 0.0006, and 0.0008 demonstrated the best performance. However, the learning rate of 0.0008 was selected due to the presence of lower range of the data distribution. Hence, the optimized GRU algorithm is defined as follows: utilizing F&D as the feature set, setting the number of hidden layers to 80, and employing a learning rate of 0.0008.
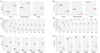 |
Fig. 5 GRU. (a) and (b) present boxplots displaying the FAR and F1 score across various features, i.e., Force, Displacement, and F&D, utilizing a constant number of hidden layers (100), learning rate (0.0006), and minibatch size (128). (c) and (d) showcase boxplots representing FAR and F1 score variations, depicting changes in the number of hidden layers while maintaining F&D as the feature set, along with a fixed learning rate of 0.0006 and minibatch size of 128. Finally, (e) and (f) exhibit boxplots illustrating differences in FAR and F1 score based on different learning rates, while keeping the number of hidden layers constant at 80, utilizing F&D as the feature set, and minibatch size of 128. The boxplots are represented with a box having a horizontal line in the center, with horizontal lines extending from each side (referred to as "whiskers"). The box represents the interquartile range (IQR), encapsulating 50% of data points falling between the first quartile and the third quartile in the dataset. The outcomes corresponding to training and validation are distinguished by black and red colors, respectively. |
4.1.4 Parameter optimization in the 1D-CNN algorithm
Figure 6 displays the outcomes derived from the feed-forward optimization conducted in three distinct phases of the proposed 1D-CNN algorithm. The results corresponding to the identification phase are represented in black, while those for the validation phase are showcased in red.
In the initial stage (Figs. 6a and 6b), the algorithm underwent feature selection with initial values set to a kernel size of 3, 256 kernels, and a learning rate of 0.0006. Similar to other mentioned algorithms, the proposed algorithm exhibited a consistent trend across different feature sets. Notably, the fusion of Force and Displacement features, i.e., F&D, yielded the highest performance, registering a FAR of 0.28% and an F1 score of 75%.
In Figures 6c and 6d, considering F&D as the feature and learning rate of 0.0006, impact of varying parameters is illustrated using notation (X, Y), with X denoting kernel size and Y indicating number of kernels. Notably, configurations such as (3, 128) and (5, 128) exhibit the lowest FAR (0.28%) and highest F1 score (75%). However, the range and maximum value of (5, 128) are comparatively smaller than those of (3, 128). Therefore, optimal performance for the CNN algorithm is achieved using 128 kernels with a size of 5.
The final phase, depicted in Figures 6e and 6f, involved experimenting with different learning rates considering fixed feature set of F&D, kernel size of 5, and number of kernels of 128. Among the explored range, a value of 0.001 emerged as the optimal choice, delivering an average F1 score of 75.5%, and maintaining an average FAR of 0.27%. Consequently, the optimized configuration for the proposed algorithm is defined as follows: utilizing F&D as the feature set, setting the kernel size at 5, establishing the number of kernels to 128, and fixing the learning rate at 0.001.
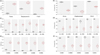 |
Fig. 6 Proposed 1D-CNN. (a) and (b) display boxplots presenting the FAR and F1 score for various features, namely Force, Displacement, and F&D, utilizing a kernel size of 3, 256 kernels, and a learning rate of 0.0006. (c) and (d) showcase boxplots of FAR and F1 score, varying kernel sizes and kernel numbers while utilizing F&D as features and a learning rate of 0.006. It is worth noting that the horizontal axis denoted by (X, Y) signifies kernel size and the number of kernels, respectively. Lastly, (e) and (f) exhibit boxplots of FAR and F1 score concerning different learning rates, maintaining a kernel size of 5, 128 kernels, and utilizing F&D as the feature set. The boxplots are represented with a box having a horizontal line in the center, with horizontal lines extending from each side (referred to as “whiskers”). The box represents the interquartile range (IQR), encapsulating 50% of data points falling between the first quartile and the third quartile in the dataset. The outcomes corresponding to training and validation are distinguished by black and red colors, respectively. |
4.2 Results
In Table 1, a performance evaluation of various optimized deep learning algorithms developed within this study is presented for easier comparison. All algorithms showcased notably low FAR, each registering below 0.4% (0.004). However, this decreased FAR correlated with a higher FRR, surpassing 24%, consequently resulting in an Equal Error Rate (EER) exceeding 12%. Overall, among the algorithms, the proposed 1D-CNN demonstrated the best performance, boasting an F1 score of 75.5%. Notably, it incurred the longest execution time at 22 milliseconds, albeit the discrepancy is relatively minor.
Table 1 presents a comprehensive performance assessment of the optimized deep learning algorithms developed within this study, facilitating easier comparison. Across all algorithms, there was a consistent demonstration of notably low False Acceptance Rates (FAR), each registering below 0.4% (0.004). However, this decrease in FAR corresponded to higher False Rejection Rates (FRR), surpassing 24%, consequently yielding an Equal Error Rate (EER) exceeding 12%. Notably, among the evaluated algorithms, the proposed 1D-CNN exhibited the most promising performance, achieving an impressive F1 score of 75.5%. It's important to highlight that despite its superior performance, the 1D-CNN incurred the longest execution time, measured at 22 milliseconds, though this discrepancy is relatively marginal. This comprehensive evaluation sheds light on the relative strengths and trade-offs observed across these deep learning architectures concerning biometric authentication metrics.
To enhance precision, our study undertook rigorous statistical comparisons among the most effective algorithms, analyzing key metrics such as FAR, FRR, F1 score, and EER. Our one-way ANOVA analysis yielded noteworthy outcomes, revealing a substantial effect on all FAR, FRR, F1 score, and EER (F(3,79) > 50.71, p < 0.001). While the average values suggested a superior performance of the 1D-CNN model, subsequent post-hoc comparisons revealed no statistically significant difference between CNN and 1D-CNN across all metrics (p > 0.665, Bonferroni corrected). It is intriguing to note that both CNN and 1D-CNN models demonstrated statistically significant superiority over other architectures (LSTM and GRU) (p < 0.001, Bonferroni corrected) across all comparative analyses. Additionally, our findings indicate that LSTM exhibited statistically significant superior performance in comparison to the GRU algorithm (p < 0.020, Bonferroni corrected). This comprehensive statistical analysis underscores the nuanced comparative performance of these deep learning architectures across various biometric authentication metrics. It should be noted that there were no significant differences observed in terms of execution time among the CNN, LSTM, and 1D-CNN algorithms (p > 0.734, Bonferroni corrected). However, the GRU algorithm exhibited a notably lower execution time compared to the other algorithms (p < 0.035, Bonferroni corrected).
Summary of results obtained from the proposed model and other basic models.
4.3 Comparing this study with related works
Table 2 summarizes studies employing force or its correlated attributes, like pressure, as biometric measures. The proposed model demonstrates high accuracy alongside a comparatively elevated FAR. Notably, this system utilizes only two features, contrasting with the multiple features integrated into other studies. This suggests potential advantages for the proposed system, including reduced storage requirements, lower computational costs, and a decreased need for numerous sensors. Moreover, the study encompassed a larger participant pool in comparison to most related works.
Assessing the outcomes of the proposed model with those of related studies.
5 Conclusion and future works
In this research endeavor, we delved into pioneering realms by introducing an authentication paradigm that harnessed force and displacement data garnered from the movements involved in the abduction of the right index finger. Our approach capitalized on the intricate capabilities of deep learning algorithms, where we meticulously fine-tuned parameters within our proposed algorithm (i.e., 1D-CNN) and rigorously benchmarked its performance against three foundational deep learning models: CNN, GRU, and LSTM. This exhaustive comparative analysis served as a robust yardstick to assess the effectiveness and superiority of our proposed method in relation to these well-established models.
The implications of our bimodal approach are highly promising, particularly within identification systems. Its streamlined complexity and reduced reliance on extensive memory space present a stark contrast to the resource-intensive demands typically associated with multimodal systems reliant on diverse sensor attributes. As we delved deeper into the analysis of feature sets extracted from a cohort of 86 subjects, the results eloquently highlighted the robust performance of CNN and especially 1D-CNN. Achieving an average F1 score of 75.5% and boasting an exceptional average accuracy rate of 99.4%, our findings unequivocally underscored the precision and reliability inherent in behavioral biometrics derived from the intricate interplay of force and displacement patterns.
An additional testament to the system's efficacy was the remarkably low average False Acceptance Rate (FAR) of 0.27%, firmly positioning our approach as an enticing prospect for integration within security systems. However, our pursuit of excellence warrants a focus on refining performance metrics, notably addressing the relatively higher False Rejection Rate (FRR) of 24.5% and the corresponding Equal Error Rate (EER) of 12.4%. These nuances, while indicative of areas for improvement, also underscore the immense potential inherent in utilizing force and displacement-based behavioral biometric traits across a spectrum of applications. These applications span the realms of keystroke analysis, gait recognition, and signature verification, promising a future where nuanced behavioral traits become instrumental in identity verification and authentication.
Moving forward, our research opens avenues for exploration, encouraging in-depth investigations to ascertain the discriminative potential of our method. This involves extending the application of force-based analysis to encompass an array of behavioral traits beyond the scope of our study. Additionally, the recognition that our study tapped into a non-ergonomic task as a viable biometric parameter holds significance, contributing a fresh perspective to the broader discourse on biometrics. Furthermore, the acknowledgment of our study's limitation arising from the constrained age range of participants reinforces the need for broader demographic considerations in future investigations.
Funding
This research received no specific grant from any funding agency in the public, commercial, or not-for-profit sectors.
Conflicts of interest
We have no conflicts of interest to disclose.
Data availability statement
Data collected for this study are available by request through the corresponding authors.
Author contribution statement
Conceptualization, F.S. and M.E.A.; Methodology, F.S., A.J.M., M.F., A.K., and M.E.A.; Software, F.S., A.J.M., and M.E.A.; Validation, F.S. A.J.M., A.K., and M.E.A.; Formal Analysis, F.S., A.J.M., and M.E.A.; Investigation, F.S., A.J.M., A.K., and M.E.A.; Resources, F.S., A.J.M., M.F., A.K., and M.E.A.; Data Curation, F.S., A.J.M., M.F., A.K., and M.E.A.; Writing – Original Draft Preparation, F.S. and M.E.A.; Writing – Review & Editing, F.S., A.J.M., M.F., A.K., and M.E.A.; Visualization, F.S. and M.E.A. Supervision, A.J.M., A.K., and M.E.A.; Project Administration, F.S., A.J.M., and M.E.A.; Funding Acquisition, F.S., A.J.M., M.F., A.K., and M.E.A.
References
- M. Karnan, M. Akila, N. Krishnaraj, Biometric personal authentication using keystroke dynamics: a review, Appl. Soft Comput. 11, 1565–1573 (2011) [Google Scholar]
- P.S. Teh, N. Zhang, A.B.J. Teoh, K. Chen, A survey on touch dynamics authentication in mobile devices, Comput. Security, 59, 210–235 (2016) [Google Scholar]
- S. Khellat-Kihel, R. Abrishambaf, J.L. Monteiro, M. Benyettou, Multimodal fusion of the finger vein, fingerprint and the finger-knuckle-print using Kernel Fisher analysis, Appl. Soft Comput. 42, 439–447 (2016) [Google Scholar]
- C. Galdi, M. Nappi, D. Riccio, H. Wechsler, Eye movement analysis for human authentication: a critical survey, Pattern Recognit. Lett. 84, 272–283 (2016) [Google Scholar]
- F. Yazdani, M. Emadi Andani, Verification based on palm vein by estimating wavelet coefficient with autoregressive model, in: 2nd Conference on Swarm Intelligence and Evolutionary Computation (CSIEC), 2017, pp. 118–122 [Google Scholar]
- M. Emadi Andani, Z. Salehi, An affordable and easy-to-use tool to diagnose knee arthritis using knee sound, Biomed. Signal Process. Control 88, 105685 (2024) [Google Scholar]
- S. Dargan, M. Kumar, A comprehensive survey on the biometric recognition systems based on physiological and behavioral modalities, Expert Syst. Appl. 143, 113114 (2020) [Google Scholar]
- M.U. Khan, Z.A. Choudry, S. Aziz, S.Z.H. Naqvi, A. Aymin, M.A. Imtiaz, Biometric authentication based on EMG signals of speech, in: 2020 International Conference on Electrical, Communication, and Computer Engineering (ICECCE), IEEE, 2020, pp. 1–5 [Google Scholar]
- S. Minaee, A. Abdolrashidi, H. Su, M. Bennamoun, D. Zhang, Biometrics recognition using deep learning: a survey, Artif. Intell. Rev. 1–49 (2023). https://doi.org/10.48550/arXiv.1912.00271 [Google Scholar]
- M. Mailah, B.H. Lim, Biometric signature verification using pen position, time, velocity and pressure parameters, J. Teknol. (2012), https://doi.org/10.11113/jt.v48.218 [Google Scholar]
- B.K. Jaisawal, Y. Perwej, S.K. Singh, S. Kumar, J.P. Dixit, N.K. Singh, An empirical investigation of human identity verification methods, Int. J. Sci. Res. Sci. Eng. Technol. (IJSRSET), 10, 16–38 (2023) [Google Scholar]
- M.H. Yaacob, S.Z.S. Idrus, W.Z.W. Ali, W.A. Mustafa, M.F. Jamlos, M.H.A. Wahab, A review on feature extraction in keystroke dynamics, J. Phys. (2020). https://doi.org/10.1088/1742-6596/1529/2/022088 [Google Scholar]
- C.R.P. Siahaan, A. Chowanda, Spoofing keystroke dynamics authentication through synthetic typing pattern extracted from screen-recorded video, J. Big Data, 9 (2022). https://doi.org/10.1186/s40537-022-00662-8 [Google Scholar]
- E. Maiorana, H. Kalita, P. Campisi, Mobile keystroke dynamics for biometric recognition: an overview, IET Biometrics, 10, 1–23 (2021) [Google Scholar]
- H. Nonaka, M. Kurihara, Sensing pressure for authentication system using keystroke dynamics. Zenodo (CERN European Organization for Nuclear Research). (2005). https://doi.org/10.5281/zenodo.1058297 [Google Scholar]
- C.S. Leberknight, G.R. Widmeyer, M. Recce, An investigation into the efficacy of keystroke analysis for perimeter defense and facility access, in: IEEE International Conference on Technologies for Homeland Security, 2008, https://doi.org/10.1109/ths.2008.4534475 [Google Scholar]
- H. Saevanee, P. Bhattarakosol, Authenticating user using keystroke dynamics and finger pressure, in: Consumer Communications and Networking Conference, 2009. https://doi.org/10.1109/ccnc.2009.4784783 [Google Scholar]
- M. Trojahn, F. Ortmeier, Toward mobile authentication with keystroke dynamics on mobile phones and tablets, Adv. Inf. Netw. Appl. (2013). https://doi.org/10.1109/waina.2013.36 [Google Scholar]
- A.E. Sulavko, A.S. Eremenko, A.K. Fedotov, Users’ identification through keystroke dynamics based on vibration parameters and keyboard pressure, Dyn. Syst. Mech. Mach. (2017). https://doi.org/10.1109/dynamics.2017.8239514 [Google Scholar]
- S. Krishnamoorthy, L. Rueda, S. Saad, H. Elmiligi, Identification of user behavioral biometrics for authentication using keystroke dynamics and machine learning, in: Proceedings of the 2018 2nd International Conference on Biometric Engineering and Applications, 2018. https://doi.org/10.1145/3230820.3230829 [Google Scholar]
- H. Lee, J. Hwang, D. Kim, S. Lee, S. Lee, J.H. Shin, Understanding keystroke dynamics for smartphone users authentication and keystroke dynamics on smartphones built-in motion sensors, Secur. Commun. Netw. 2018, 1–10 (2018) [Google Scholar]
- C. Wu, W. Ding, R. Liu, J. Wang, A.C. Wang, J.J. Wang, S. Li, Y. Zi, Z.L. Wang, Keystroke dynamics enabled authentication and identification using triboelectric nanogenerator array, Mater. Today, 21, 216–222 (2018) [Google Scholar]
- H. Lee, J. Hwang, S. Lee, D. Kim, S. Lee, J. Lee, J.H. Shin, A parameterized model to select discriminating features on keystroke dynamics authentication on smartphones, Pervasive Mob. Comput. 54, 45–57 (2019) [Google Scholar]
- S.A. Alsuhibany, A.S. Almuqbil, Analyzing the effectiveness of touch keystroke dynamic authentication for the arabic language, Wirel. Commun. Mob. Comput. 2021, 1–15 (2021) [Google Scholar]
- A.B. López, Deep learning in biometrics: a survey, ADCAIJ: Adv. Distrib. Comput. Artif. Intell. J. 8, 19–32 (2019) [Google Scholar]
- P. Terrier, Gait recognition via deep learning of the center-of-pressure trajectory, Appl. Sci. 10, 774 (2020). [Google Scholar]
- J. Moon, N.H. Minaya, N.A. Le, H.C. Park, S.I. Choi, Can ensemble deep learning identify people by their gait using data collected from multi-modal sensors in their insole? Sensors 20, 4001 (2020) [Google Scholar]
- D. Deb, A. Ross, A.K. Jain, K. Prakah-Asante, K.V. Prasad, Actions speak louder than (pass) words: passive authentication of smartphone users via deep temporal features, in: 2019 international conference on biometrics (ICB), IEEE, 2019, June, pp. 1–8. https://doi.org/10.1109/ICB45273.2019.8987433 [Google Scholar]
- Y. Sun, Q. Gao, X. Du, Z. Gu, Smartphone user authentication based on holding position and touch-typing biometrics, Comput. Mater. Continua, 61, (2019). https://doi.org/10.32604/cmc.2019.06294 [Google Scholar]
- G. Stragapede, R. Vera-Rodriguez, R. Tolosana, A. Morales, A. Acien, G. Le Lan, Mobile behavioral biometrics for passive authentication, Pattern Recognit. Lett. 157, 35–41 (2022) [Google Scholar]
- G. Stragapede, R. Vera-Rodriguez, R. Tolosana, A. Morales, BehavePassDB: benchmarking mobile behavioral biometrics, 2022. arXiv preprint arXiv:2206.02502. https://doi.org/10.48550/arXiv.2206.02502 [Google Scholar]
- G. Stragapede, P. Delgado-Santos, R. Tolosana, R. Vera-Rodriguez, R. Guest, A. Morales, Mobile keystroke biometrics using transformers, in: 2023 IEEE 17th International Conference on Automatic Face and Gesture Recognition (FG), IEEE, 2023, January, pp. 1–6 [Google Scholar]
- M. Fiorio, M. Emadi Andani, A. Marotta, J. Classen, M. Tinazzi, Placebo-induced changes in excitatory and inhibitory corticospinal circuits during motor performance, J. Neurosci. 34, 3993–4005 (2014) [Google Scholar]
- M. Emadi Andani, M. Tinazzi, N. Corsi, M. Fiorio, Modulation of inhibitory corticospinal circuits induced by a nocebo procedure in motor performance, PLOS ONE, 10, e0125223 (2015) [Google Scholar]
- N. Corsi, M. Emadi Andani, M. Tinazzi, M. Fiorio, Changes in perception of treatment efficacy are associated to the magnitude of the nocebo effect and to personality traits, Sci. Rep. 6, (2016). https://doi.org/10.1038/srep30671 [Google Scholar]
- G. Rossettini, M. Emadi Andani, F. Dalla Negra, M. Testa, M. Tinazzi, M. Fiorio, The placebo effect in the motor domain is differently modulated by the external and internal focus of attention, Sci. Rep. 8, (2018). https://doi.org/10.1038/s41598-018-30228-9 [Google Scholar]
- B. Villa-Sánchez, M. Emadi Andani, M. Fiorio, The role of the dorsolateral prefrontal cortex in the motor placebo effect, Eur. J. Neurosci. 48, 3410–3425 (2018) [Google Scholar]
- Y. Sun, F.P. Lo, B. Lo, EEG-based user identification system using 1D-convolutional long short-term memory neural networks, Exp. Syst. Appl. 125, 259–267 (2019) [Google Scholar]
Cite this article as: Foroogh Sharifi, Ata Jahangir Moshayedi, Mitra Fouladirad, Amin Kolahdooz, Mehran Emadi Adnani, Utilizing Force and Displacement in Unnatural Index Finger Movements for Authentication, Int. J. Simul. Multidisci. Des. Optim. 17, 4 (2026), https://doi.org/10.1051/smdo/2026002
All Tables
All Figures
|
Fig. 1 Overview of the proposed biometric identification system based on force and displacement applied by the index finger. |
| In the text | |
|
Fig. 2 The architecture of the proposed 1D-CNN algorithm. |
| In the text | |
|
Fig. 3 CNN. (a) and (b) display boxplots presenting the FAR and F1 score for various features, namely Force, Displacement, and F&D, utilizing a kernel size of 3, 256 kernels, and a learning rate of 0.006. (c) and (d) showcase boxplots of FAR and F1 score, varying kernel sizes and kernel numbers while utilizing F&D as features and a learning rate of 0.008. It is worth noting that the horizontal axis denoted by (X, Y) signifies kernel size and the number of kernels, respectively. Lastly, (e) and (f) exhibit boxplots of FAR and F1 score concerning different learning rates, maintaining a kernel size of 5, 128 kernels, and utilizing F&D as the feature set. The boxplots are represented with a box having a horizontal line in the center, with horizontal lines extending from each side (referred to as “whiskers”). The box represents the interquartile range (IQR), encapsulating 50% of data points falling between the first quartile and the third quartile in the dataset. The outcomes corresponding to training and validation are distinguished by black and red colors, respectively. |
| In the text | |
|
Fig. 4 LSTM. (a) and (b) display boxplots presenting the FAR and F1 score for various features, namely Force, Displacement, and F&D, utilizing the fixed number of hidden layers of 100, learning rate of 0.0006, and minibatch size of 128. (c) and (d) showcase boxplots of FAR and F1 score, presenting variations in the numbers of hidden layers maintaining F&D as the feature set, alongside a fixed learning rate of 0.0006, and minibatch size of 128. Finally, (e) and (f) exhibit boxplots demonstrating FAR and F1 score differences based on different learning rates, while keeping the number of hidden layers constant at 60 and utilizing F&D as the feature set. The boxplots are represented with a box having a horizontal line in the center, with horizontal lines extending from each side (referred to as “whiskers”). The box represents the interquartile range (IQR), encapsulating 50% of data points falling between the first quartile and the third quartile in the dataset. The outcomes corresponding to training and validation are distinguished by black and red colors, respectively. |
| In the text | |
|
Fig. 5 GRU. (a) and (b) present boxplots displaying the FAR and F1 score across various features, i.e., Force, Displacement, and F&D, utilizing a constant number of hidden layers (100), learning rate (0.0006), and minibatch size (128). (c) and (d) showcase boxplots representing FAR and F1 score variations, depicting changes in the number of hidden layers while maintaining F&D as the feature set, along with a fixed learning rate of 0.0006 and minibatch size of 128. Finally, (e) and (f) exhibit boxplots illustrating differences in FAR and F1 score based on different learning rates, while keeping the number of hidden layers constant at 80, utilizing F&D as the feature set, and minibatch size of 128. The boxplots are represented with a box having a horizontal line in the center, with horizontal lines extending from each side (referred to as "whiskers"). The box represents the interquartile range (IQR), encapsulating 50% of data points falling between the first quartile and the third quartile in the dataset. The outcomes corresponding to training and validation are distinguished by black and red colors, respectively. |
| In the text | |
|
Fig. 6 Proposed 1D-CNN. (a) and (b) display boxplots presenting the FAR and F1 score for various features, namely Force, Displacement, and F&D, utilizing a kernel size of 3, 256 kernels, and a learning rate of 0.0006. (c) and (d) showcase boxplots of FAR and F1 score, varying kernel sizes and kernel numbers while utilizing F&D as features and a learning rate of 0.006. It is worth noting that the horizontal axis denoted by (X, Y) signifies kernel size and the number of kernels, respectively. Lastly, (e) and (f) exhibit boxplots of FAR and F1 score concerning different learning rates, maintaining a kernel size of 5, 128 kernels, and utilizing F&D as the feature set. The boxplots are represented with a box having a horizontal line in the center, with horizontal lines extending from each side (referred to as “whiskers”). The box represents the interquartile range (IQR), encapsulating 50% of data points falling between the first quartile and the third quartile in the dataset. The outcomes corresponding to training and validation are distinguished by black and red colors, respectively. |
| In the text | |
Current usage metrics show cumulative count of Article Views (full-text article views including HTML views, PDF and ePub downloads, according to the available data) and Abstracts Views on Vision4Press platform.
Data correspond to usage on the plateform after 2015. The current usage metrics is available 48-96 hours after online publication and is updated daily on week days.
Initial download of the metrics may take a while.