")
")
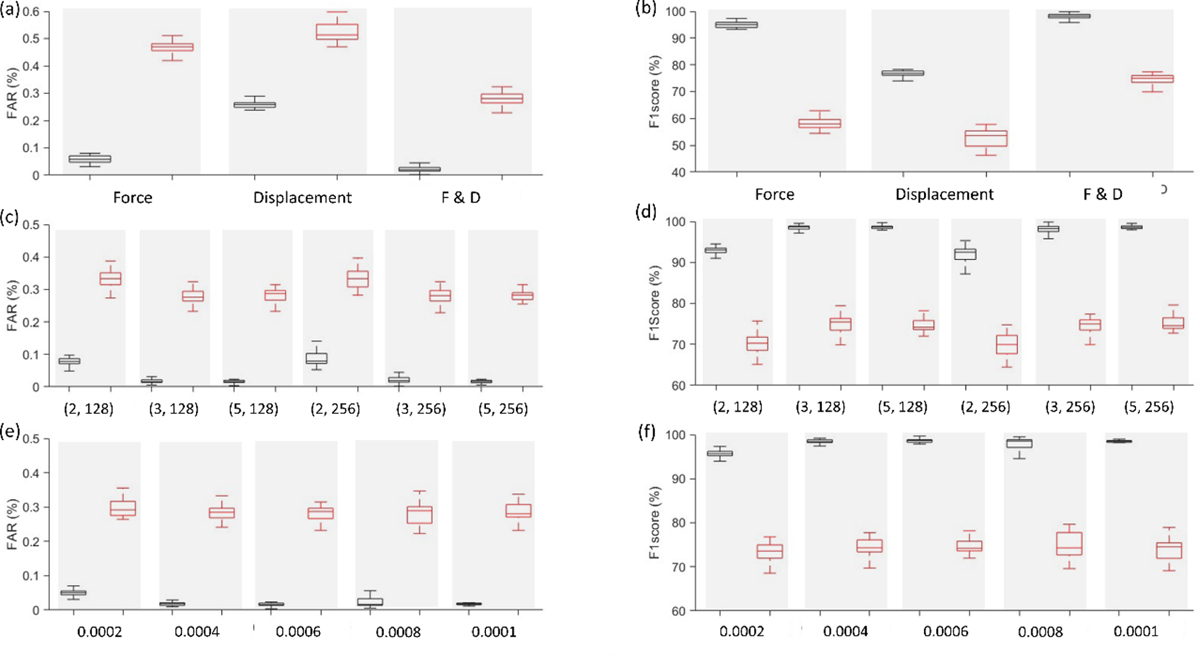
Fig. 6
Download original image
Proposed 1D-CNN. (a) and (b) display boxplots presenting the FAR and F1 score for various features, namely Force, Displacement, and F&D, utilizing a kernel size of 3, 256 kernels, and a learning rate of 0.0006. (c) and (d) showcase boxplots of FAR and F1 score, varying kernel sizes and kernel numbers while utilizing F&D as features and a learning rate of 0.006. It is worth noting that the horizontal axis denoted by (X, Y) signifies kernel size and the number of kernels, respectively. Lastly, (e) and (f) exhibit boxplots of FAR and F1 score concerning different learning rates, maintaining a kernel size of 5, 128 kernels, and utilizing F&D as the feature set. The boxplots are represented with a box having a horizontal line in the center, with horizontal lines extending from each side (referred to as “whiskers”). The box represents the interquartile range (IQR), encapsulating 50% of data points falling between the first quartile and the third quartile in the dataset. The outcomes corresponding to training and validation are distinguished by black and red colors, respectively.
Current usage metrics show cumulative count of Article Views (full-text article views including HTML views, PDF and ePub downloads, according to the available data) and Abstracts Views on Vision4Press platform.
Data correspond to usage on the plateform after 2015. The current usage metrics is available 48-96 hours after online publication and is updated daily on week days.
Initial download of the metrics may take a while.