")
")
| Issue |
Int. J. Simul. Multidisci. Des. Optim.
Volume 17, 2026
|
|
|---|---|---|
| Article Number | 2 | |
| Number of page(s) | 15 | |
| DOI | https://doi.org/10.1051/smdo/2025037 | |
| Published online | 2026年3月09日 | |
Research Article
Study on cone yarn category recognition method based on SimAM-ResNet18
School of Mechanical Engineering, Zhejiang University of Water Resources and Electric Power, Hangzhou, 310018, PR China
* e-mail: 该Email地址已收到反垃圾邮件插件保护。要显示它您需要在浏览器中启用JavaScript。
Received:
17
August
2025
Accepted:
14
December
2025
Abstract
To address the issue of low recognition accuracy of yarn tube types in practical industrial scenarios, this study proposes a SimAM-ResNet18-based image recognition method for cone yarns. Different from the traditional yarn recognition method based on Resnet, the framework introduced in this study combines parameter free attention and swish activation to improve the recognition accuracy and robustness under industrial conditions. First, a high-resolution image acquisition system was designed and implemented. The acquired images were preprocessed using bilateral filtering, Gamma correction, HSI color space extraction, and rapid template matching of edge points to enhance image features. Then, the Swish activation function and SimAM attention mechanism were integrated into the ResNet18 network, effectively improving the model's focus on key regions and its feature representation capabilities. On a dataset composed of 1800 real-world images collected from a textile production line, the proposed model achieved a recognition accuracy of 98.3%, a precision of 0.969, a recall of 0.972, and an F1-score of 0.970, significantly outperforming mainstream models such as MobileNetV2, EfficientNet-B0, and SENet18. Without retraining, the model maintained an accuracy of 92.8% under challenging conditions such as angle variation and illumination changes, demonstrating strong generalization capability and practical industrial value.
Key words: Cone yarns image / image preprocessing / machine vision / image recognition
© C. Deng and M. Li, Published by EDP Sciences, 2026
 This is an Open Access article distributed under the terms of the Creative Commons Attribution License (https://creativecommons.org/licenses/by/4.0), which permits unrestricted use, distribution, and reproduction in any medium, provided the original work is properly cited.
1 Introduction
In recent studies on the automated detection of cone yarns, with the continuous advancement of image recognition and machine learning technologies, researchers have increasingly focused on employing machine vision techniques to identify cone yarns categories in order to improve recognition accuracy and efficiency. Some scholars have pointed out that illumination variation and background interference are the main factors affecting recognition accuracy. Therefore, it is necessary to develop algorithms with strong robustness to enhance the quality of cone yarns images [1,2]. Secondly, to overcome the limitations of single-feature recognition, numerous studies have adopted multi-feature fusion strategies that integrate color, texture, and shape features to comprehensively capture subtle differences on the surface of cone yarns [3,4]. In addition, to further improve the real-time performance of cone yarns classification, some researchers have introduced lightweight neural network architectures to balance model complexity and inference speed [5,6].
However, existing research still exhibits significant shortcomings in real industrial applications. First, due to complex factors such as image blur during winding, angular deviation, and background interference, the standardized image datasets relied upon in many studies cannot truly reflect the diversity and disturbances present in industrial environments. This leads to a clear performance gap between model training and actual deployment [7,8]. Second, although some works have introduced color space conversion and image enhancement algorithms in the feature extraction stage, color and texture features remain difficult to extract stably under conditions such as local overexposure, shadow, or peeling of printed labels. This easily causes blurred target contours or loss of boundary information, ultimately affecting classification accuracy [9]. Furthermore, some studies attempt to achieve model lightweighting through structural compression, but this often sacrifices the non-linear representation capability of the model, making it difficult to capture fine-grained features present in the wound structure and reducing its ability to distinguish between easily confused categories [10,11].
In recent years, with the continuous development of deep convolutional neural networks (CNNs), they have shown powerful feature extraction capabilities in image classification and object detection tasks. Some researchers have begun to apply CNNs to cone yarns recognition. For example, modeling cone yarns images based on the classical ResNet architecture can achieve relatively high recognition accuracy. However, the standard ResNet model typically uses the ReLU activation function, which outputs zero for negative inputs, leading to the “dying neuron” problem and limiting the model’s non-linear representation capacity [12]. To overcome this limitation, the Swish activation function was proposed and has been proven to perform better in gradient propagation and overall performance in various image recognition tasks [13]. However, its application in cone yarns recognition remains underexplored and lacks systematic evaluation.
Meanwhile, attention mechanisms, as key modules to enhance neural networks’ feature selection capabilities, have gradually attracted research interest. Typical structures such as SENet and CBAM introduce channel or spatial attention mechanisms to strengthen focus on key regions, significantly improving robustness in complex backgrounds [14,15]. However, these structures generally have large parameter counts and high computational complexity, making them difficult to deploy directly in industrial production lines. To address this, SimAM (Simple Attention Module), a lightweight and parameter-free attention mechanism, was proposed. It models local importance based on a neural energy function, offering both performance and efficiency advantages [16], and is suitable for real-time industrial vision tasks.
Most previous yarn recognition methods rely on controlled datasets and struggle to maintain high accuracy in real industrial environments, where issues such as motion blur, illumination variation, and background interference are prevalent. Furthermore, although attention mechanisms like SE and CBAM enhance feature representation, they introduce considerable computational overhead and are unsuitable for real-time deployment on production lines. In addition, prior works typically focus on isolated improvements—either in preprocessing or in model design—without providing a unified framework that integrates image acquisition, robust preprocessing, and lightweight deep learning for industrial applicability.
In summary, ensuring high recognition accuracy while maintaining model lightweightness and robustness remains a major challenge in cone yarn image recognition. To overcome issues such as insufficient nonlinear feature modeling, high computational cost of attention mechanisms, and strong dependence on image quality, this study proposes a SimAM-ResNet18-based cone yarn recognition method. The system is enhanced from both hardware and algorithmic perspectives. A high-resolution, interference-resistant image acquisition system was developed to capture clear and stable cone yarn images under industrial conditions. In preprocessing, bilateral filtering, gamma correction, and HSI color space extraction are employed to enhance image quality and feature contrast. During feature extraction, the Swish activation function is introduced to improve nonlinear representation, while the SimAM attention mechanism is integrated to refine the model’s focus on critical regions such as edge structures and printed patterns. Experimental results demonstrate that the proposed SimAM-ResNet18 model achieves superior performance on a real-world textile dataset, significantly outperforming mainstream models across multiple metrics, and exhibits strong generalization and industrial applicability.
The remainder of this paper is organized as follows: Section 2 presents the design of the cone yarn image acquisition system and preprocessing methods; Section 3 details the proposed SimAM-ResNet18 model and experimental analysis; and Section 4 concludes the study with key findings and discussions on future research directions.
2 Image acquisition and preprocessing for cone yarn
In the process of cone yarn category recognition based on machine vision, it is essential to effectively transform physical samples into image data that can be processed by computer systems. To ensure the proposed method has practical industrial applicability, a stable and efficient image acquisition system must be designed and constructed according to the actual production environment. Moreover, since the captured images often contain irrelevant information such as cluttered backgrounds and spindle shadows, image preprocessing algorithms must be developed to enhance feature extraction and improve recognition accuracy in subsequent analysis.
2.1 Image acquisition of cone yarn
In the image acquisition stage, considering the conical and annular symmetric structure of the yarn tube as well as the use of printed patterns combining colors and textures on the smaller end of the tube, several factors must be taken into account to facilitate accurate yarn type recognition in subsequent algorithms:
a. Optical isolation
The entire image acquisition system should be placed inside a fully enclosed darkroom. A non-reflective black coating is applied to suppress external light interference, thereby eliminating color cast under varying illumination conditions and providing a stable input for subsequent color correction and pattern recognition.
b. Instantaneous high-intensity illumination
A high-brightness flash lighting source is installed in front of the high-speed camera. The flash is triggered synchronously with the camera’s shutter to ensure short-duration, uniform illumination. This configuration allows the surface of the yarn spindle and tube patterns to remain clearly visible even during motion.
c. Precise triggering and alignment
A fast-response photoelectric sensor is used to detect the position of the cone yarn and generate an external trigger signal to activate the camera. This ensures that the lens remains vertically aligned with the center of the yarn spindle. Furthermore, due to inward or outward bulging near the paper tube in large spindles, which may cause shadows or deformation under different viewing angles, a robotic arm is employed to finely adjust the position for precise alignment.
To meet the above acquisition requirements, a high-performance cone yarn image acquisition system was developed in this study, as illustrated in Figure 1. The system utilizes a Hikvision MV-CH1510-10XC-M72-NF industrial camera equipped with a Sony IMX411 sensor, capable of capturing ultra-high-resolution images at 14208 × 10640 pixels, thereby ensuring that fine details of the yarn and tube patterns are clearly visible. The lighting module adopts a high-brightness annular LED light source to provide uniform illumination, effectively avoiding motion blur and local shadows. A photoelectric sensor is responsible for detecting when the spindle is in place and then promptly triggering both the camera and lighting system. Additionally, a light-shielding enclosure made of iron panels lined with black velvet fabric is used to eliminate internal reflections and isolate external light sources.
The operating principle of the system is as follows: when the cone yarn reaches the predefined shooting position, the photoelectric sensor instantly detects the arrival of the spindle and outputs a trigger signal. Upon receiving this signal, the central control unit first instructs the light source driver to momentarily activate the high-brightness ring light, providing uniform and intense illumination for the camera. It then issues the shooting command to trigger the industrial camera for high-resolution image acquisition. The entire process is completed within a few milliseconds, ensuring that clear images without motion blur or shadows are captured at the precise moment of spindle movement. A sample cone yarn image captured by the system is shown in Figure 2.
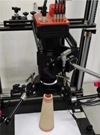 |
Fig. 1 Acquisition device of the cone yarn image. |
 |
Fig. 2 Original image of cone yarn. |
2.2 Image preprocessing of cone yarn
As shown in Figure 2, the acquired raw image not only contains the cone yarn tube region but also includes irrelevant background areas. Moreover, the tube region occupies only a small portion of the overall image, and direct feature extraction may introduce a large amount of redundant information. In addition, variations in surface reflectivity of the tube often result in low image contrast and blurred details, with the tube region appearing particularly dark. To address these issues and improve recognition accuracy, the raw image must first undergo enhancement, denoising, and color extraction processing.
Figure 3 illustrates the overall pipeline of cone yarn image preprocessing. The workflow consists of six sequential stages: image acquisition, noise suppression using bilateral filtering, brightness enhancement through gamma correction, color feature extraction in the HSI space, fast edge-point template matching for precise localization, and annular unwrapping for region linearization. This integrated pipeline ensures high-quality image input for subsequent feature extraction and classification.
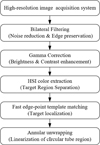 |
Fig. 3 Overall pipeline of cone yarn image preprocessing. |
2.2.1 Noise reduction of cone yarn images
In cone yarn image processing, noise can significantly interfere with the extraction of critical textures and edge features, ultimately reducing the accuracy of subsequent tasks such as color segmentation and object recognition. This problem is further amplified after contrast enhancement, as enhanced textures may also make noise more pronounced. Therefore, effective image denoising is essential.
To suppress image noise interference and improve overall image quality, commonly used denoising methods include mean filtering, Gaussian filtering, median filtering, and bilateral filtering [17]. Among them, mean filtering removes noise by averaging the pixel values within a local neighborhood, but it tends to blur image edges. In contrast, Gaussian filtering applies a weighted average based on the Gaussian distribution, which helps alleviate some blurring issues while still potentially causing edge information loss. The mathematical formulation of Gaussian filtering is given as follows:
 (1)
(1)
where the dimension of the Gaussian filtering convolution kernel is 2; and the δ represents the standard deviation of the discrete two-dimensional Gaussian kernel function.
The median filtering has a good noise suppression effect on images, but its ability to handle structural details in complex backgrounds is limited. The corresponding formula is as follows:
 (2)
(2)
where the med denotes the median operation; the F(x,y) and G(x,y) represent the original and the processed images respectively; and W denotes the window.
Bilateral filtering can effectively smooth random noise and background texture in the image while preserving edge details. It is a nonlinear filtering method that balances noise suppression and edge preservation. The core idea is to consider both the spatial distance between neighboring pixels and the current pixel, and the intensity similarity between them, i.e., a dual weighting in both the spatial domain and the intensity domain. The formula is as follows:
 (3)
(3)
where the I′(p) denotes the output intensity value of pixel p after filtering; I(q) denotes the original intensity value of neighboring pixel q; Ω denotes the neighborhood centered at p; Gs(·) denotes the spatial Gaussian kernel function; Wp denotes the normalization factor.
Figure 4 compares the denoising performance of different filtering methods. It can be observed that bilateral filtering is more suitable for the paper tube images used in this study, which contain both texture information and distinct edges. Therefore, bilateral filtering is selected in this paper as the noise removal method for paper tube images.
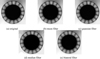 |
Fig. 4 Comparison of filtering results for different methods. |
2.2.2 Image enhancement for cone yarn
In image processing, filtering is commonly used as an initial preprocessing step, with the primary goal of removing high-frequency noise or low-frequency noise to improve the signal-to-noise ratio (SNR) of the image. Although filtering effectively suppresses random interference and irregular textures, it inevitably leads to issues such as edge blurring and detail loss due to the attenuation of certain frequency components [18]. To further highlight meaningful information in the image and enhance local features, image enhancement is necessary. Common enhancement methods include sharpening, contrast enhancement, and gamma correction.
Specifically, image sharpening is a spatial enhancement technique primarily used to enhance edge information and improve the clarity of image details [19]. Based on its sharpening effect, this study adopts Laplacian sharpening, which emphasizes regions with rapid intensity changes to highlight edge structures. The corresponding expression is given as follows:
 (4)
(4)
where, the Iorig denotes the original image; the ∇2I represents the second-order Laplacian derivative of the image; and α is the sharpening coefficient.
Contrast enhancement expands the gray-level distribution of the image, making bright areas brighter and dark areas darker, thereby improving visual contrast [20]. In this study, linear gray-level stretching is employed, which maps the gray range of the original image to a target range [Lmin, Lmax]. The corresponding expression is given as follows:
 (5)
(5)
where, the range [Lmin, Lmax] is typically set to [0, 255].
Gamma correction is a nonlinear enhancement method designed based on the characteristics of human visual perception, and it exhibits a certain degree of adaptability. The transformation formula is as follows:
 (6)
(6)
where, the γ denotes the gamma coefficient, which determines the overall brightness of the image. When γ < 1, the image becomes brighter; whereas when γ > 1, the image becomes darker.
The enhancement results of the above methods are shown in Figure 5.
As shown in Figure 4, gamma correction achieves a balanced improvement in brightness and contrast, enhancing both visual quality and structural details. Specifically, the sharpened image exhibits a clear improvement in edge detail enhancement, making the structural contours more distinct. However, sharpening enhances the gradient of gray-level variations, which may cause residual high-frequency noise in textured or fluctuating brightness regions to be mistakenly enhanced as edges, resulting in increased image noise. In contrast, contrast-enhanced images provide stronger visual distinction between light and dark areas by stretching the gray-level distribution, which makes boundaries between bright and dark regions more prominent, thereby enhancing the overall layering and structural perception of the image. However, this method may further amplify already bright regions, leading to overexposure and causing the loss of detail and excessively sharp edges. Compared to the above methods, gamma-corrected images achieve a better balance across multiple enhancement dimensions. By applying a nonlinear mapping function, gamma correction effectively enhances the brightness of dark regions, allowing hidden structural information in the background to be better revealed, while avoiding over-enhancement of bright areas. The gamma-enhanced image also presents a more natural gray-level distribution, with clearly visible internal and external layers of the paper tube, and smooth, artifact-free edge transitions. This not only improves image quality but also preserves detail to the greatest extent, facilitating the performance of subsequent image processing algorithms.
To quantitatively evaluate the performance of different enhancement methods, the mean gray value, gray-level standard deviation, and image entropy were computed, as listed in Table 1.
Further analysis of Table 1 shows that the sharpened image has the lowest image entropy, indicating insufficient detail preservation; the contrast enhancement method excels in improving contrast but tends to cause local detail loss; in comparison, the gamma correction method demonstrates balanced performance across mean gray value, gray-level standard deviation, and image entropy, preserving information more comprehensively and yielding more stable enhancement results. Therefore, gamma correction is selected as the preferred image enhancement method in this study.
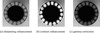 |
Fig. 5 Comparison of image enhancement effects. |
Comparison of statistical results.
2.2.3 Color extraction
Color information is an essential component of paper tube images, and the extraction of color features is closely related to the choice of color space [21]. Color extraction is performed by inputting a color image and applying threshold values set on the three channels in a specified color space to extract the target region, resulting in a binary image containing only the target area (target pixels valued at 255, others at 0), as shown in Figure 6. Common color spaces include RGB, HSV, and HSI.
Specifically, the RGB color space consists of three primary colors: red, green, and blue. In the RGB model, color extraction is typically performed by setting threshold ranges for the three channels to extract the target region. The corresponding formula is expressed as follows:
 (7)
(7)
The HSV color space consists of hue, saturation, and value components. Its conversion formulas are as follows:
 (8)
(8)
 (9)
(9)
 (10)
(10)
where, the target color region can be extracted by setting the thresholds as  ,
,  , and
, and  .
.
The HSI color space is similar to HSV, but places greater emphasis on distinguishing between intensity and color components [22]. The conversion formulas are as follows:
 (11)
(11)
 (12)
(12)
 (13)
(13)
To compare the performance of the three color spaces in extracting the color region of cone yarn paper tube images, threshold values were set in RGB, HSV, and HSI spaces for the same image, and color extraction was performed accordingly. The results are shown in Figure 7.
As observed in Figure 6, the RGB color space, which expresses color information through a combination of three channels, tends to reduce the color distinction between the paper tube and the background under significant lighting variations or complex backgrounds. This leads to blurred object boundaries and compromises the accuracy of subsequent binarization. Moreover, the strong correlation among RGB channels makes it difficult to independently set extraction thresholds, indicating certain limitations of the RGB color space in processing paper tube images. Although the HSV color space provides better color representation than RGB, its value (brightness) component is highly susceptible to environmental lighting variations, and the saturation component is prone to distortion in areas with pale printing or reflections. These issues may result in incomplete recognition of the paper tube region and discontinuous edges. In contrast, the HSI color space demonstrates superior adaptability in paper tube image processing. Under the same lighting conditions and background, threshold-based color extraction in the HSI space can more accurately separate the paper tube region, effectively avoiding boundary blurring in RGB and brightness imbalance in HSV. Therefore, the HSI color space is selected in this study as the primary method for color extraction of cone yarn images.
 |
Fig. 6 Binary diagram of the target region. |
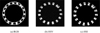 |
Fig. 7 Comparison results of RGB, HSV, and HSI color spaces. |
2.2.4 Template matching
In the preprocessing workflow of cone yarn image recognition, template matching serves as a critical intermediate step, accurately locating the target region and providing precise starting coordinates for the image unwrapping module. In this study, a fast edge-point-based matching algorithm is adopted for template matching in cone yarn images. This algorithm offers high computational efficiency, strong noise resistance, and good adaptability to complex image backgrounds [23], significantly improving overall processing speed while maintaining matching accuracy. Compared to traditional grayscale matching, this method exhibits greater robustness for images with distinct structural features, making it particularly suitable for scenarios where the cone yarn edges are clear and the texture is complex.
The principle of the fast edge-point-based matching algorithm can be expressed as follows:
 (14)
(14)
where, the x and scaleX represent the translation and scaling factor along the x-axis, while the y and scaleY represent the translation and scaling factor along the y-axis; the θ denotes the rotation angle of the template. Based on these five parameters, the template is scaled, rotated, and translated to align with the target position in the image. At this stage, Fs and Fm denote the feature sets of the target and template images, respectively, and θ represents the rotation angle of the template. The function S = (Fm, Fs) measures the similarity score between the template and the target image features.
The workflow of the algorithm is illustrated in Figure 8.
And the example of the similarity scores computed by the algorithm is shown in Table 2.
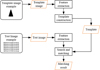 |
Fig. 8 Workflow diagram of the fast edge-point-based matching algorithm. |
Example of similarity scores from the fast edge-point-based matching algorithm.
2.2.5 Annular unwrapping
The core of paper tube annular unwrapping is to transform the circular (annular) region of the image into a rectangular representation within a specified angular range. This enables linear visualization of the ring-shaped image, facilitating subsequent processes such as color feature extraction, texture analysis, and pattern recognition, thereby improving the efficiency and accuracy of image processing and recognition. The workflow of the annular unwrapping process for the paper tube is shown in Figure 9.
Specifically, the dimensions of the target unwrapped annular image are determined by the geometric parameters of the ring. Assuming that the outer and inner radii of the ring in the original image are OutRadius and InRadius, respectively, and the unwrapping angle is Δθ, the width DstW of the unwrapped image corresponds to the average arc length covered by the angle, and the height DstH corresponds to the radial thickness of the ring. The calculation formulas are as follows:
 (15)
(15)
where, when θ = 2π, the unwrapping represents a full annular expansion; when θ < 2π, it corresponds to a partial unwrapping.
To map each pixel in the unwrapped image back to its corresponding position in the original image, it is necessary to perform a coordinate transformation from the Cartesian coordinate system to the polar coordinate system. A schematic of the coordinate transformation for the paper tube is shown in Figure 10. Specifically, the key to coordinate transformation is determining the corresponding point P′(x′,y′) in the unwrapped rectangular image for any given point P(x,y) in the annular region. In cone yarn image processing, the image is typically acquired by vertically capturing the scene, in which the outer edge (where the yarn contacts the paper tube) and the inner hollow edge form a pair of concentric circles with a common center O(x0,y0). If a ray is drawn from the center O, it intersects the inner and outer circles at points A(xa,ya) and B(xb,yb), respectively.
The coordinates of points A and B can be expressed as follows:
 (16)
(16)
where, Ra denotes the radius of the inner circle; and Rb denotes the radius of the outer circle.
Moreover, any point within the annular region can be uniquely identified by the polar radius ρ of the ray and its angle θ with respect to the horizontal axis, enabling the annular region to be systematically and continuously transformed into a rectangular image.
 (17)
(17)
The annular image unwrapped using the above method is shown in Figure 11.
 |
Fig. 9 The workflow of the annular unwrapping process. |
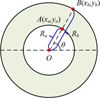 |
Fig. 10 Schematic diagram of coordinate transformation for the paper tube. |
 |
Fig. 11 Unwrapped annular image. |
3 Cone yarn category recognition based on SimAM-ResNet18
3.1 SimAM-ResNet18 model approach
3.1.1 ResNet18 network
The Residual Neural Network (ResNet) is a deep learning architecture that introduces residual blocks and “shortcut connections” to effectively mitigate issues such as gradient explosion and degradation commonly encountered in the training of traditional deep neural networks, thereby enabling more efficient training of deep models. In this study, ResNet18 is adopted for cone yarn image classification. The network structure and corresponding parameters of ResNet18 are Table 3.
As shown in Table 3, the convolutional and pooling layers of ResNet18 are similar to those in traditional convolutional neural networks. The convolution operation is primarily used for feature extraction from input data, while the pooling layers serve to reduce dimensionality, lower computational cost, and enhance model robustness. Regarding the activation function, ResNet18 adopts the ReLU function by default, which is expressed as:
 (18)
(18)
In addition, Batch Normalization (BN) is employed in ResNet18 to accelerate the training process and improve model stability.
 (19)
(19)
where, μres and σres represent the mean and variance, respectively; γres and βres denote the scaling and shifting parameters; εres is a small constant added for numerical stability.
For the loss function, cross-entropy loss is adopted, which enhances the prediction accuracy by measuring the difference between the model’s predicted values and the actual labels, as shown in equation (20).
 (20)
(20)
where, the regex denotes the regularization term, which aims to constrain the model complexity, prevent overfitting, and thereby enhance the generalization capability of the model.
Structural parameters of the ResNet18.
3.1.2 Swish activation function
In cone yarn image recognition tasks, the conventional ResNet18 network adopts the ReLU activation function by default. Although ReLU performs robustly in most visual tasks, it suffers from issues such as “neuron death” and discontinuity [24], which may limit model performance when dealing with complex textures and fine edges in cone yarn images. To address this, the Swish activation function is introduced in the model design as a replacement for ReLU, aiming to improve recognition accuracy and robustness in cone yarn image classification.
Swish, proposed by the Google Brain team, is a novel activation function with smooth and continuous nonlinearity. It avoids complete gradient suppression for small input values, thereby preserving more detailed information in the feature map [25]. The Swish activation function is defined as follows:
 (21)
(21)
where, the σ(·) denotes the sigmoid function; and the β is a tunable hyperparameter that controls the degree of nonlinearity; it is typically set to 1 as the default configuration.
The comparison between the Swish activation function used in this study and the ReLU function is illustrated in Figure 12.
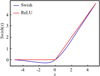 |
Fig. 12 Swish and ReLU activation function comparison. |
3.1.3 SimAM attention module
In cone yarn image recognition tasks, even after preprocessing, the images often contain strong background interference, weak target details, and blurred paper tube boundaries. Although the introduction of the Swish activation function enhances the smoothness and nonlinearity of feature extraction, convolutional neural networks still face limitations in effectively focusing on critical information across feature channels and spatial dimensions. To further improve the model's ability to attend to key image regions (e.g., paper tube edges, inner and outer ring boundaries, and color label areas), this paper integrates the SimAM (Simple Attention Module) into the Swish-optimized ResNet18 architecture.
SimAM is a lightweight, parameter-free attention module based on a neuron energy function. It does not rely on additional trainable weights [26]. In the SimAM module, each neuron in the input feature map is assigned an energy score. This score is computed using a parameter-free energy function, which measures the contribution of each neuron to the entire feature channel. Suppose the ith neuron in a given feature map channel is denoted as xi, its energy function is defined as follows:
 (22)
(22)
where, ω and b denote the weight and bias of the linear transformation; λ is the regularization coefficient controlling smoothness of the energy function.
To obtain the optimal weight and bias in the energy function, SimAM employs the following analytical solution:
 (23)
(23)
where, the μ and σ2 represent the mean and variance of all neurons in the current channel excluding the target neuron; and l denotes the value of the target neuron.
Substituting the analytical solution into the energy function yields the simplified expression of the minimum energy as follows:
 (24)
(24)
A lower minimum energy indicates a larger deviation of the neuron from its surroundings, implying a stronger representativeness in the current feature channel. Hence, the attention score is defined as the reciprocal of the minimum energy to reflect its significance. To obtain the final attention weights for the entire feature map, SimAM applies the Sigmoid activation function for normalization, as shown in equation (24):
 (25)
(25)
where, E denotes the set of minimum energy values for all neurons in the feature map; and X is the original feature map.
Based on these characteristics, the structure of the SimAM attention module is illustrated in Figure 13.
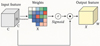 |
Fig. 13 Structure of the SimAM attention module. |
3.1.4 Cone yarn category recognition model based on SimAM-ResNet18
To effectively improve the classification accuracy of cone yarn images, this study integrates the Swish activation function and the SimAM attention mechanism into the conventional ResNet18 architecture, thereby constructing a more task-adaptive image recognition model, referred to as the SimAM-ResNet18 model. While retaining the advantages of the residual structure, the model enhances its attention to key image regions and improves feature representation by replacing the activation function and incorporating the attention mechanism. This leads to more accurate recognition of intricate textures and blurred boundaries in cone yarn images.
The overall architecture of the SimAM-ResNet18 model is illustrated in Figure 14.
As illustrated in Figure 13, the input image is first uniformly resized and fed into the initial convolutional layer for low-level feature extraction. This stage uses a 7 × 7 convolutional kernel in combination with BN and the Swish activation function to enhance the continuity and nonlinear expressiveness of feature extraction. Next, a max-pooling operation is applied to reduce the spatial dimensions of the feature map, providing appropriately sized input features for the subsequent residual learning modules.
The backbone consists of four groups of residual blocks, each containing several basic residual units. To strengthen the model’s ability to focus on critical regions (such as tube edges and color band markings), a SimAM attention module is inserted after each stage to compute energy scores for the neurons and apply adaptive weighting, thereby improving attention performance.
Finally, global average pooling is applied to compress the extracted high-dimensional features, followed by a fully connected layer and a softmax classifier to produce the category prediction of the cone yarn image. During training, the cross-entropy loss function is used as the optimization objective to measure the discrepancy between predicted outputs and ground truth labels, guiding parameter updates and iterative model optimization.
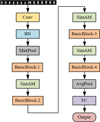 |
Fig. 14 SimAM-ResNet18 network. |
3.2 Experimental setup and result analysis
3.2.1 Experimental setup
To comprehensively evaluate the performance of the proposed SimAM-ResNet18 model in cone yarn image category recognition tasks, all experiments were conducted on a computing platform equipped with an NVIDIA GeForce RTX 4060 Ti 8 GB GPU, an Intel Core i9-13900K CPU, and 32GB of RAM. The cone yarn image dataset was collected from a real-world textile production line. After standardized preprocessing, a classification dataset comprising 1800 images across four categories (i.e. Green-Straight, Brown-Straight, Pink-Straight, and Pink-Slant) was constructed, as shown in Figure 15. The dataset was split into training, validation, and testing sets in a ratio of 7:2:1 to ensure scientific rigor and consistency in model training and evaluation.
To further analyze the model’s discriminative capability across different categories, a confusion matrix was introduced to visualize the experimental results, with its structure illustrated in Table 4.
Meanwhile, to comprehensively evaluate the model’s performance, four commonly used metrics (i.e. accuracy, precision, recall, and F1-score) were employed. The corresponding formulas are given as equations (25)–(28).
a. accuracy:
 (26)
(26)
b. precision:
 (27)
(27)
c. recall:
 (28)
(28)
b. F1-score:
 (29)
(29)
 |
Fig. 15 Four common cone yarn categories. |
Principle of the confusion matrix.
3.2.2 Result analysis
To validate the specific contributions of the Swish activation function and the SimAM attention module to the overall model performance, the proposed SimAM-ResNet18 model was compared against other models listed in Table 5. All experiments were conducted under consistent conditions, including the same training dataset, loss function (cross-entropy), optimizer (Adam), and hyperparameter configuration (learning rate=0.001, batch size=32, epoch=100). The comparative results and corresponding confusion matrices are shown in Table 6 and Figure 16, respectively. Among them, Table 6 summarizes the quantitative comparison between the four resnet18 based variants.
As shown in Table 6 and Figure 15, there are significant differences in the classification performance of bobbin yarn images across various model architectures. The baseline model M1 exhibits the lowest performance in all four metrics, namely accuracy, precision, recall, and F1-score. Its accuracy reaches only 93.9 percent, indicating limited capability in recognizing complex textures and blurred detail regions. Model M2, with the Swish activation function introduced, demonstrates a notable improvement. The accuracy increases to 96.1 percent, suggesting that Swish performs better in capturing nonlinear features and small signals, while also effectively mitigating the dead neuron problem often associated with the ReLU function. Model M3 incorporates the SimAM attention mechanism, which enables the network to extract more representative information in both the channel and spatial dimensions of feature maps. Consequently, the model’s accuracy improves to 96.7 percent, and the F1-score reaches 0.955. This result confirms the effectiveness of SimAM in enhancing the representation of local structures and critical regions. Finally, Model M4, which combines both Swish and SimAM, achieves the best overall performance among all models. It reaches an accuracy of 98.3 percent and an F1-score of 0.970, indicating superior discriminative capability in cone yarns classification.
Further analysis based on the confusion matrices shown in Figure 15 reveals that the baseline model M1 exhibits significant misclassification among multiple categories. In particular, frequent errors occur between the “Pink-Slant” and “Brown-Straight” classes. As the model architecture becomes progressively optimized, classification accuracy improves accordingly. The M4 model achieves high-precision recognition across all categories with virtually no noticeable misclassifications, demonstrating excellent inter-class discrimination and overall robustness.
Meanwhile, the SimAM-ResNet18 model was compared with other typical models (such as MobileNetV2, EfficientNet-B0, and SENet18), and the results are shown in Table 7.
As shown in Table 7, although both EfficientNet-B0 and SENet18 demonstrate strong feature extraction capabilities and certain lightweight advantages in the field of image recognition, their overall performance in the task of cone yarns image classification remains inferior to that of the proposed SimAM ResNet18 model. This performance gap can be attributed to the higher complexity of feature discrimination inherent in this task. Specifically, industrial scenarios present challenges such as strong background interference, weak cone texture, blurred color boundaries, and large variations in shooting angles. Traditional models, originally designed for natural images or conventional object detection tasks, often lack sufficient feature discriminability when dealing with targets characterized by strong intra-class similarity and fine-grained differences. More specifically, although MobileNetV2 introduces depth wise separable convolution to significantly reduce the number of parameters and computational cost, thereby offering a clear lightweight advantage, this comes at the expense of feature representation capacity. Its accuracy on this task is only 91.7%, and both precision and recall are the lowest among the compared models. This indicates its limited ability to capture the discriminative features in cone-shaped yarn images, such as fine textures, color blending regions, and complex edges, which consequently restricts its classification accuracy. EfficientNet-B0, built upon a compound scaling strategy, exhibits a favorable trade-off between accuracy and efficiency on general datasets such as ImageNet. However, its optimization is biased toward global semantic representation, making it less effective in modeling the dual demands of local geometric boundaries and fine texture structures required in this study. As a result, its accuracy remains at 94.8%, and significant misclassifications and inter-class ambiguity are still observed. n comparison, SENet18 enhances the original ResNet18 by introducing the Squeeze and Excitation module, which improves inter-channel information modeling. This leads to an accuracy of 95.6%, along with noticeable improvements in precision and recall. These results suggest that the channel attention mechanism can contribute to modeling inter-class differences in cone yarns images. However, due to the lack of sufficient focus on local key regions in the spatial dimension, the model still shows a tendency toward misclassification in areas with blurred edges, significant texture disturbances, or gradual color transitions. Experimental results demonstrate that SimAM ResNet18 outperforms all comparison models in four key metrics: accuracy (98.3%), precision (0.969), recall (0.972), and F1 score (0.970). Compared with MobileNetV2, EfficientNet-B0, and SENet18, the proposed SimAM-ResNet18 achieves consistently higher accuracy, precision, recall, and F1-score. This improvement is attributed to the Swish activation, which enhances nonlinear representation, and the parameter-free SimAM mechanism, which strengthens attention to edge structures and printed patterns without increasing computational complexity. These advantages allow SimAM-ResNet18 to maintain more stable performance under noise, illumination variation, and perspective changes.These results confirm that the proposed SimAM-ResNet18 not only achieves higher accuracy but also maintains better generalization under complex industrial conditions. And the stability of the training process can be inferred from the consistent improvement and stabilization of performance across metrics, indicating that the model converged properly during optimization.
In addition, to further evaluate the model’s adaptability to different real-world scenarios, two datasets were constructed: one with horizontally placed bobbin samples and the other with inclined bobbin samples (sample images and dataset details are shown in Fig. 17 and Tab. 8, respectively), simulating other typical scenarios on the production line.
The combined dataset contains 3600 images. Without any retraining or fine-tuning, the pretrained model was directly applied for prediction to assess its generalization performance. The results are shown in Figure 17.
As shown in Figure 18, the overall accuracy reaches 92.8%, indicating that the model maintains strong discriminative capability and robustness when faced with practical industrial disturbances such as angle variations, image inclinations, and background differences. Specifically, the model performs particularly well in recognizing the “Pink-Twisted” category, demonstrating strong adaptability to texture changes and complex edges. However, there remains some confusion in inclined categories such as “Brown-Inclined”, suggesting that there is still room for improvement in detail extraction under certain viewing angles.
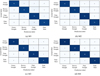 |
Fig. 16 Confusion matrices of different models. |
Information of each model.
Comparison of recognition results among models.
Comparison results between SimAM-ResNet18 model and other typical models.
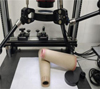 |
Fig. 17 Examples of horizontally and inclined placed cone yarns. |
Information of the dataset.
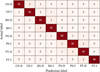 |
Fig. 18 Confusion matrice. |
4 Conclusion
This study presents a deep learning-based method for cone yarn image recognition suitable for industrial environments. The ResNet18 architecture was enhanced by incorporating the Swish activation function and the SimAM attention mechanism. During preprocessing, bilateral filtering and gamma correction were used to improve image quality, the HSI color space was employed for precise target region extraction, and a fast edge-based matching algorithm was applied for efficient and accurate template localization. The proposed SimAM-ResNet18 model achieved a classification accuracy of 98.3%, a precision of 0.969, a recall of 0.972, and an F1-score of 0.970, outperforming MobileNetV2 (accuracy 91.7%), EfficientNet-B0 (accuracy 94.8%), and SENet18 (accuracy 95.6%). Moreover, on an extended test set containing eight categories with various inclination angles, the model achieved an accuracy of 92.8% without retraining, demonstrating strong adaptability and stability under background clutter, texture interference, and viewpoint variations. Overall, the results indicate that the proposed method provides high recognition performance and shows strong potential for real-world industrial applications.
Future studies will focus on real-time deployment optimization, domain adaptation for unseen yarn types, and integration with edge computing systems for in-line inspection.
Funding
This work was sponsored by the Basic Public Welfare Research Project of Zhejiang, Project Name: Key Technology Research on the Complete Automation Equipment for the End Process of Spinning Production Line. Project Source: Department of Science and Technology of Zhejiang Province, Grant No. LGG21E050007.
Conflicts of interest
The authors declare no conflicts of interest.
Data availability statement
The data used to support the findings of this study are available from the corresponding author upon request.
Author contribution statement
D.C.G. conceived the study; D.C.G. and L.M.F. were the principal investigators; L.M.F. analyzed the data; L.M.F. wrote the manuscript; L.M.F. revised the manuscript.
References
- J. Zhang, W. Shi, Y. Zhang et al., Research on multi label feature recognition of bobbin and yarn based on YoloColor-Net, J. Ind. Text. 2024, 54 (2024) [Google Scholar]
- F.J. Jun, Y.L. Hai, H.Z. Huan et al., Detection of bobbin yarn surface defects by visual saliency analysis, Fibers Polym. 21, 2685–2694 (2020) [Google Scholar]
- L.H. Shi, L. Zheng, J. Wei et al., A deep multi-instance neural network for dyeing-free inspection of yarn dyeing uniformity, Eng. Appl. Artif. Intell. 2023, 123 (2023) [Google Scholar]
- C. Pedro, S. Filipe, P. Filipe et al., Automatic system for yarn quality analysis by image processing, J. Braz. Soc. Mech. Sci. Eng. 44, (2022) [Google Scholar]
- D. Ning, H.H. Xiao, X.X. Kai et al., Lightweight bobbin yarn detection model for auto-coner with yarn bank, Sci. Rep. 14, 16136 (2024) [Google Scholar]
- C.X. Ma, N. Zhang, R. Pan, Detection of cheese yarn bobbin varieties based on support vector machine, J. Text. Res. 44, 194–200 (2023) [Google Scholar]
- C. Liu, Y.L. Chen, Research on application of ant colony algorithm based on multi-sensor image fuzzy fusion in image recognition, J. Phys.: Conf. Ser. 1682, 012050 (2020) [Google Scholar]
- C.W. Yu, X.X. Shu, K. Byeong et al., Generating training images with different angles by GAN for improving grocery product image recognition, Neurocomputing, 488, 694–705 (2022) [Google Scholar]
- J. Zhang, H. Su, T. Zhang et al., Multi-scale fusion underwater image enhancement based on HSV color space equalization, Sensors, 25, 2850–2850 (2025) [Google Scholar]
- Q. Zheng, T. Peng, D. Huang et al., A light-weight model with granularity feature representation for fine-grained visual classification, Int. J. Comput. Sci. Eng. 27, 341–351 (2024) [Google Scholar]
- T.T. Nguyen, A.H. Pham, P.T. Nguyen, A light-weight backbone to adapt with extracting grouped dilation features, Pattern Anal. Appl. 28, 27–27 (2025) [Google Scholar]
- J.J. Liu, Y.F. Liu, Research on neural network with a new activation function for energy consumption prediction of machine tools, Control Eng. China, 32, 492–499 (2025) [Google Scholar]
- M. Palani, A. Perumalsamy, Next-gen deepfake detection: ResNet-Swish-BiLSTM model to deliver superior accuracy in visual forensics, Security & Privacy, 8, e70027–e70027 (2025) [Google Scholar]
- S. Wang, W. Liang, F. Shi, Identification of coating layer pipeline defects based on the GA-SENet-ResNet18 model, Int. J. Press. Vessels Piping, 212, 105327–105327 (2024) [Google Scholar]
- X. Tong, Z. Liang, F. Liu, Succulent plant image classification based on lightweight GoogLeNet with CBAM attention mechanism, Appl. Sci. 15, 3730–3730 (2025) [Google Scholar]
- H. Bao, X. Qi, Image restoration based on SimAM attention mechanism and constraint adversarial network, Evol. Syst. 16, 39–39 (2025) [Google Scholar]
- H.C. Luo, Information-enhanced image denoising method based on deep learning, Int. J. Pattern Recognit. Artif. Intell. 39, (2025) [Google Scholar]
- L. Zhao, C. He, Gaussian highpass guided image filtering, Digit. Signal Process. 165, 105344–105344 (2025) [Google Scholar]
- J. Zhang, H. Zhang, T. Wang et al., Customized priors for enhanced multispectral and hyperspectral image sharpening, Inf. Fusion 122, 103172–103172 (2025) [Google Scholar]
- M. Mirzapour, K.A. Nasab, A. Movafeghi et al., Retinex theory based automated contrast enhancement of gamma radiographic images of pipe welds, J. Nondestruct. Eval. 44, 75–75 (2025) [Google Scholar]
- K. Ke, B. Zhang, C. Zhang et al., Underwater image enhancement via color correction and multi-feature image fusion, Meas. Sci. Technol. 35, (2024) [Google Scholar]
- M. Mengjun, W. Shanqin, PA-ColorNet: progressive attention network based on RGB and HSV color spaces to improve the visual quality of underwater images, Signal Image Video Process. 17, 3405–3413 (2023) [Google Scholar]
- A. Hristov, D. Dimov, N.M. Pavlova, Self-Supervised foundation model for template matching, Big Data Cognit. Comput. 9, 38–38 (2025) [Google Scholar]
- Y.H. Yang, H. Cheng, J.H. Wei et al., High-precision lightweight quantization inference method for prevalent activation functions in transformer models in edge device deployment, Acta Electron. Sinica, 52, 3301–3311 (2024) [Google Scholar]
- K. Heena, C. Anuradha, A.S. Prakash, ModSwish: a new activation function for neural network, Evol. Intell. 17, 2637–2647 (2024) [Google Scholar]
- Y. Zhang, T.Y. Gao, L.L. Cui, Detection and recongnition of power meter based on lightweight neural network and SimAM attention mechanism, J. Shenyang Normal Univ. (Natural Science Edition), 42, 340–345 (2024) [Google Scholar]
Cite this article as: Chenggang Deng, Mingfan Li, Study on cone yarn category recognition method based on SimAM-ResNet18, Int. J. Simul. Multidisci. Des. Optim. 17, 2 (2026), https://doi.org/10.1051/smdo/2025037
All Tables
All Figures
|
Fig. 1 Acquisition device of the cone yarn image. |
| In the text | |
|
Fig. 2 Original image of cone yarn. |
| In the text | |
|
Fig. 3 Overall pipeline of cone yarn image preprocessing. |
| In the text | |
|
Fig. 4 Comparison of filtering results for different methods. |
| In the text | |
|
Fig. 5 Comparison of image enhancement effects. |
| In the text | |
|
Fig. 6 Binary diagram of the target region. |
| In the text | |
|
Fig. 7 Comparison results of RGB, HSV, and HSI color spaces. |
| In the text | |
|
Fig. 8 Workflow diagram of the fast edge-point-based matching algorithm. |
| In the text | |
|
Fig. 9 The workflow of the annular unwrapping process. |
| In the text | |
|
Fig. 10 Schematic diagram of coordinate transformation for the paper tube. |
| In the text | |
|
Fig. 11 Unwrapped annular image. |
| In the text | |
|
Fig. 12 Swish and ReLU activation function comparison. |
| In the text | |
|
Fig. 13 Structure of the SimAM attention module. |
| In the text | |
|
Fig. 14 SimAM-ResNet18 network. |
| In the text | |
|
Fig. 15 Four common cone yarn categories. |
| In the text | |
|
Fig. 16 Confusion matrices of different models. |
| In the text | |
|
Fig. 17 Examples of horizontally and inclined placed cone yarns. |
| In the text | |
|
Fig. 18 Confusion matrice. |
| In the text | |
Current usage metrics show cumulative count of Article Views (full-text article views including HTML views, PDF and ePub downloads, according to the available data) and Abstracts Views on Vision4Press platform.
Data correspond to usage on the plateform after 2015. The current usage metrics is available 48-96 hours after online publication and is updated daily on week days.
Initial download of the metrics may take a while.