")
")
| Issue |
Int. J. Simul. Multidisci. Des. Optim.
Volume 17, 2026
|
|
|---|---|---|
| Article Number | 5 | |
| Number of page(s) | 10 | |
| DOI | https://doi.org/10.1051/smdo/2025033 | |
| Published online | 17 March 2026 | |
Research Article
Simulation analysis of transmission chain dynamic response of wind turbine
1
Science and Technology Research Institute (STRI), China Three Gorges Corporation, Beijing, 101149, PR China
2
Three Geoges Jinsha River Yunchuan Hydropower Development Co., Ltd., Kunming, Yunnan, 650000, PR China
3
School of Civil and Hydraulic Engineering, Huazhong University of Science and Technology, Wuhan, Hubei, 430074, PR China
4
CNRS, Université Marie et Louis Pasteur, FEMTO-ST UMR 6174, 25030 Besançon, France
* e-mail: This email address is being protected from spambots. You need JavaScript enabled to view it.
Received:
18
September
2025
Accepted:
22
October
2025
Abstract
Establishment of transmission chain system dynamics equation: the pure torsion elastic dynamic model of wind turbine transmission chain system is established by using the Dalembert principle. In the process of establishing the dynamic equations, the time-varying wind torque obtained by the wind wheel is taken as the external load. The average wind speed is 11 m/s, the standard deviation of wind speed is 2.31, the Weibull distribution scale parameter C is the tie value of the annual average of the three wind towers is 8.179, and the average value of the annual average of the shape parameter of the three wind towers K is 2.938. Dynamic response of transmission chain system: using MATLAB through Runge-Kutta method, programming the system dynamic response, get the wind turbine transmission system in the external excitation and internal excitation of the transmission system, such as disc parts vibration displacement, vibration speed, gear between dynamic engagement force, and the inherent mode of the whole system. Modal analysis of the transmission chain reveals three key natural frequencies: 18.6 Hz (dominant mode from low-speed shaft), 36.4 Hz (from first-stage planetary gears), and 57.8 Hz (from high-speed parallel gear). These frequencies are significantly higher than the turbine's operational frequency range (0.3–5 Hz, corresponding to rotor speed 19 r/min and generator speed 1800 r/min), confirming no torsional resonance risk during normal operation.
Key words: Natural wind speed / wind turbine / transmission chain / dynamic response / finite element analysis
© D. Yang et al., Published by EDP Sciences, 2026
 This is an Open Access article distributed under the terms of the Creative Commons Attribution License (https://creativecommons.org/licenses/by/4.0), which permits unrestricted use, distribution, and reproduction in any medium, provided the original work is properly cited.
1 Introduction
Energy is related to the development of global human society, and in the past few centuries, the energy is not only non-renewable, reserves less and less and cause great pollution to the global environment, the whole human survival ecosystem caused the destruction of [1,2]. First, unlike previous studies focusing on steady-state load analysis or single-stage gear models, this study establishes a 13-degree of freedom (DOF) multi-stage torsional model that covers the entire transmission chain from the hub to the generator, enabling accurate prediction of load propagation. Second, the integration of the stochastic Weibull wind model with active control mechanisms (pitch and yaw) addresses the deficiency of fixed wind load assumptions in traditional models [3]. More than 10 times the total exploitation and utilization on the earth, wind energy has great potential. Therefore, rational utilization of wind energy is an important way to reduce the pressure of environmental pollution and energy shortage. Wind power generation is an important form of wind energy utilization, and is one of the important core ways to realize the conversion of wind energy into electricity. In the past 10 yr, wind power generation has grown rapidly, and the annual installed capacity growth rate since 2000 is 20%–30% [4]. This study addresses three key gaps in existing literature: First, most prior works focus on either steady-state wind load analysis or single-component dynamic modeling, lacking an integrated framework that links stochastic wind input to multi-stage transmission chain response. Second, few studies combine lumped-parameter dynamic models with finite element (FE) verification of gear stress, leading to uncertainties in load prediction accuracy. Third, the symmetry of torsional vibration in planetary gear stages—critical for reliability design—has not been systematically analyzed under real wind conditions [5,6].
In the mechanical design part must consider the wind turbine dynamics, Excluding random changes in external loads, Wind turbine dynamics is a problem of rigid-flexible coupled many-body dynamics composed of structure dynamics and system dynamics, Even though the external load is a fixed value due to the mutual coupling action of the various components of the system, System is also an irregular nonlinear response [7,8], As wind turbines generally work in remote mountainous areas, coastal islands, and grassland and pastures with inconvenient transportation, Its working environment, installation, carrying technical difficulty mostly determines the high cost of wind turbine maintenance, This requires the wind turbines to have high reliability, The wind turbine transmission chain system composed of blade, wheel hub, main shaft and gear box is a dangerous component of frequent wind turbine failure [9,10]. And wind speed in the real environment is unpredictable, and has a strong randomness and seasonal, cause the wind turbine external load irregular changes, therefore, and because the gearbox transmission system of various internal time-varying mesh stiffness [11,12].
Third, the combination of Matlab-based dynamic response simulation and ANSYS finite element analysis (FEA) of gear pairs provides a more comprehensive validation than single-method studies. These improvements enhance the reliability of the simulation results and provide a more practical reference for wind turbine design [13,14]. Obviously, the measured error value or error curve function is the best used to reflect the actual situation, but due to the limitation of the test conditions, it is difficult to achieve in the actual production. Moreover, only accuracy requirements, no specific error value [15,16].
2 Simulation and calculation of natural wind speed in northwest area
2.1 Mathematical model of two-parameter Weibull-distribution
The wind is an important index to measure the distribution characteristics of wind energy resources, as shown in equation (1). The Weibull distribution scale parameter (C, unit: m/s) is the average value of the annual averages of the three wind towers (8.179), and the shape parameter (K, dimensionless) is the average of the annual averages of the three wind towers (2.938).
 (1)
(1)
Wind speed of wind frequency is the wind speed interval is 1 m/s, and then count the number of times in the wind speed interval, as formula (2), also can reflect the wind farm a time in the probability of each wind speed.
 (2)
(2)
A large number of measured data show that the two-parameter weibull model distribution of wind speed in a region is shown in equation (3).
 (3)
(3)
When using Weibull distribution to represent the wind frequency distribution of wind speed, the key is to solve the parameters of weibull distribution, as shown in equation (4). The solution method mainly includes statistical estimation method, etc.
 (4)
(4)
In order to improve the accuracy of wind speed simulation calculation, this chapter uses the statistical estimation method and the least squares method to obtain the two parameters of Weibull, as shown in equation (5), and then takes the average of the arithmetic as the final parameter value. Where Γ is the Gamma function, which is a key mathematical tool for calculating the expected value of the Weibull distribution.
 (5)
(5)
Both the two parameters are estimated by the statistical estimation method, as shown in equation (6), that is, the weibull distribution is estimated by the two parameters using the average wind speed and the standard deviation.
 (6)
(6)
2.2 Parameter estimation of Weibull distribution and wind-to-torque conversion
Converting wind speed distribution to mechanical torque input for the drivetrain involves two key steps first calculating the aerodynamic power captured by the rotor and second converting this power into torque considering control mechanisms The aerodynamic power from wind is determined by a specific relationship where air density is one point two two five kilograms per cubic meter the rotor swept area is calculated using the formula for the area of a circle with a rotor diameter of eighty five meters the instantaneous wind speed comes from the Weibull model the wind energy utilization coefficient has a maximum value of zero point four three in this study the tip speed ratio is five point seven and the pitch angle is another key parameter
Parameter estimates of the Weibull distribution of two parameters were calculated from the least squares estimation method. It is to determine the pending parameters of the equation according to the principle of minimum sum of square of squares. Equation (7) provides an empirical approximation.
 (7)
(7)
The wind wheel produces kinetic energy under the impetus of the natural wind speed, and this kinetic energy is the input power of the gearbox. According to the mathematical model of the wind wheel capture power, equation (8) calculates the Weibull scale parameter C.
 (8)
(8)
If the wind turbine continues to operate, it will damage the wind turbine, as shown in formula (9), the shutdown is forced, so the torque obtained by the gearbox is also 0.
 (9)
(9)
As shown in formula (10) and as shown in formula (11), the wind turbine will ensure that the torque obtained by the wind turbine reaches the rated value through a series of actions such as paddle and yaw.
 (10)
(10)
 (11)
(11)
The actual time-varying torque and time-varying speed are obtained by the weibull model distribution simulation of the wind speed and the joint simulation of the torque of the wind turbine, as shown in equation (12).
 (12)
(12)
3 Mathematical model
3.1 Vibration model of transmission chain system of wind turbine generator set
Due to the external wind speed is random change, which causes the wind power gearbox input torque in time change, because the wind turbine transmission system will be caused by the random wind load impact, this will make the whole transmission chain system dynamic load also changes dramatically, time-varying input torque increased the transmission chain system of nonlinear dynamic response [17,18]. Plus, wind turbines as high erection equipment, generally work in low temperature, traffic inconvenience, annual average wind speed is larger, the natural environment of wilderness, coastal shoals, the wind turbine high transportation cost, maintenance difficulties, so the mechanical system relative to other mechanical equipment requirements have higher reliability and service life of [19,20]. Schematic of the multi-step simulation process from wind speed modeling to dynamic response and FE verification. The steps are as follows: (1) Input wind tower data (annual average wind speed, standard deviation) to estimate Weibull parameters via statistical estimation and least squares; (2) Generate time-varying wind speed sequences using the Weibull model; (3) Convert wind speed to aerodynamic torque using the rotor power formula; (4) Input torque into the 13-DOF torsional model and solve for dynamic responses using the Runge-Kutta method; (5) Export time-varying meshing force as a load for ANSYS FE analysis of gear pairs; (6) Validate dynamic responses by comparing FE stress results with lumped-parameter load predictions.
Figure 1 shows the vibration analysis diagram of the transmission chain system of wind turbine generators. The establishment of the dynamic process is established by the different description methods of wind energy resources, so the different methods will also lead to the change of the established mathematical model describing the wind speed [21]. Study of wind energy resources stroke frequency distribution characteristics is an important basis to describe the characteristics of wind energy resources, wind speed distribution is wind speed statistical probability distribution, according to previous research found that the actual wind speed model meet certain statistical law, commonly used wind frequency model Weibull model [22], AR model, Rayleigh distribution model, log normal distribution model, the two parameters of Weibull wind speed model is the most widely used.
The paper on the whole transmission chain system greatly simplified, and the dynamic response in the fan is the most complex, oversimplified after the dynamic response of the system and the actual system produces a big difference between [23,24]. Dimension reduction: Matrix decomposition (via singular value decomposition, SVD) is applied to identify dominant vibration modes. Only modes with singular values exceeding 10% of the maximum are retained, reducing the dataset dimension by approximately 60% while preserving more than 95% of response energy. Physical quantity extraction: Vibration displacement (angular displacement) and velocity are directly extracted from the reduced-order solution. Gear meshing forces are calculated using a specific method that considers the time-varying stiffness between meshing gears, their relative displacement, the damping coefficient between them, and their relative angular velocity [25]. Due to the extreme of the working environment and the severity of the use conditions, the wind turbine growth rate box is required to have the following basic characteristics: large transmission ratio, long life, high efficiency, small volume, light weight, easy maintenance and so on [26]. Gear transmission system is the most complex coupling elastic system in the transmission chain system, through the analysis of gear transmission coupling system dynamics, can intuitively display the gearbox internal parts movement rules and dynamic characteristics, help to improve and guide the study of high-quality gear transmission system, it is also to improve the transmission chain system stability and reliability of one of the most important processes.
 |
Fig. 1 Vibration model for wind turbine transmission chain. |
3.2 Dynamics equivalent model of the wind turbine transmission chain system
Equivalent model method refers to the combination of mathematical theory and practical problems, the real problems down to the corresponding mathematical problems, from the perspective of qualitative or quantitative research object, can solve practical problems to provide accurate data or reliable guidance method, is the most basic and indispensable steps in research practical problems [27,28]. The torsional elastic dynamic equations are derived using D'Alembert's principle, which states that the sum of inertial forces, elastic forces, damping forces, and external loads equals zero for each component. The 13-DOF system is discretized such that each rotating component (hub, low-speed shaft, three gear stages, high-speed shaft, generator rotor) is modelled as an independent inertia element. In wind power transmission system is gear transmission is the most complex place, this paper applies centralized quality method to establish the whole wind power transmission chain system pure torsion dynamics model, the system is composed of spring, mass, damping unit, due to the system of freedom up to 13, if consider the three directions of the vibration, vibration system degree of freedom will greatly increase, vibration model will become very complex. Figure 2 is dynamics analysis diagram, and according to previous research when the radial support stiffness ratio of mesh stiffness ratio is more than 10, the pure torsion model and translation-torsion model analysis result is very close, and the degree of freedom, so the transverse and axial elastic deformation of transmission shaft, and bearing and support elastic deformation of pure torsion model. The gear is regarded as the mass unit, the gear vision is used as the spring, the damping unit, and each shaft is regarded as the torsion spring unit. The growth box is an important component in the whole transmission chain system. According to previous experience, the failure ratio of the gear box is also the largest in the whole wind turbine.
When analysing the elastic deformation of the gear pair, in order to establish a more accurate elastamics model, it needs to be equivalent to the gear pair model. Due to the bonding force and displacement of the gear in the direction of gear transmission. In order to facilitate the establishment of the dynamic equations, the generalized coordinates of the gears along the mesh line. Let the rotational angle displacement of the gear be 9, and the rotational freedom of the solar wheel is converted into a micro displacement along the engagement line of the planetary wheel according to the newly defined rotation coordinate. There are four methods to establish system dynamics equations: Dalamembert principle (Newton's equation of motion), Lagrangian method, influence coefficient method and Hamilletian method. The four methods only differ and get the same results. D 'Lambert's principle is a method to establish analytical model according to the balance condition of force between the mass blocks; the general form of Lagrangian equation is applicable to both conservative and non-conservative systems, so the equation of motion is derived on the basis of the force equation or the matrix form of the flexibility influence coefficient; Hamillton principle is a method of applying the Lagrangian function to derive the differential equation of motion according to the variation principle. To generate time-varying wind speed sequences, random samples are drawn from the Weibull distribution using these parameters. These speed values are then converted to aerodynamic torque through a specific calculation method. A larger scale parameter increases the average wind speed and thus the mean torque input, while a higher shape parameter reduces torque fluctuations by narrowing the wind speed range. This is critical for predicting fatigue loads, as narrower speed distributions decrease cyclic stress amplitude.
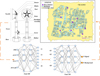 |
Fig. 2 Dynamics analysis schematic of wind turbine transmission chain. |
4 Modality dynamic response analysis
4.1 Inherent characteristics of the transmission chain system
Gear transmission system is a complex elastic mechanical system. Because the gear system is coupled to each other, even under the action of constant external force load, each gear inside the growth box also produces a dynamic load that changes with time. Different from other gearboxes, the wind power growth box is mainly reflected in that the external load of the gearbox is randomly changed. The dynamic load generated and the internal time-varying excitation of the gearbox are the main reasons for the vibration of the gear in the process of meshing. Figure 3 is chain system analysis diagram, and because the gear coincidence is not an integer, so the gear involved in the number is periodically over time, resulting in the meshing stiffness changes periodically with time, so in the gear transmission process is a dynamic meshing process over time. External and internal excitations are distinguished by their origins and frequency characteristics. External excitations arise from environmental and operational factors external to the drivetrain itself, with the primary source being time-varying aerodynamic torque induced by random wind speed fluctuations (modeled via the Weibull distribution). Additional external loads include tower shadow effects and wind shear, which introduce low-frequency variations (0.1–1 Hz) aligned with rotor rotation.
Each drivetrain component is represented as follows: Rotor hub and generator rotor are lumped inertia elements that capture the rotational mass distribution. Shafts, including low-speed, intermediate, and high-speed ones, are spring-damper pairs with stiffness and damping coefficient values specific to each component, which are summarized in it. Gearbox stages: each gear, such as planetary, sun, and ring gears, is modeled as an inertia element, with meshing interfaces represented by time-varying spring-damper pairs where stiffness is updated according to the meshing angle. In this paper, finally displays it into the Fourier series and arranges the time-varying meshing stiffness of the gear pair after neglecting the higher order term. During the gear process. Because the error is chronotropic, this forms a displacement excitation in the engagement process. In the gear dynamics, the displacement excitation caused by this error is called the error excitation, which together with the stiffness excitation constitute the internal excitation of the gear vibration. Generally speaking, in the dynamics of gear transmission system, starting from the study of the dynamic excitation of tooth closing error, the error of gear deviation is often decomposed into tooth distance deviation and tooth shape deviation. After introducing the concept of transmission error, the gear deformation and gear error can be combined to represent the transmission error. This provides a powerful tool for the internal excitation of gear engagement. In the gear dynamics analysis, the error is usually represented by the periodic displacement change on the gear engagement line of action.
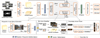 |
Fig. 3 Inherent characteristics analysis of transmission chain system. |
4.2 Analysis of the kinetic response properties of the system
The first two problems to be solved are the calculation of the system natural frequency and the determination of the system natural vibration pattern. It is the inherent characteristics of the structure, but has nothing to do with the external load, and the system mass, moment of inertia, structural stiffness, supporting conditions and so on. If the boundary conditions change, the natural frequency and vibration type of the system will change accordingly. When the boundary conditions are certain, the natural frequency and vibration type of the system will mainly depend on its inertia and elasticity. Figure 4 for the dynamic response characteristic analysis diagram, the most important application of the natural frequency of the calculation system is to avoid the resonance area of the system and the vibration pattern of the system, the calculation analysis of the calculation analysis can determine whether the transmission system components caused system violent vibration, and according to the dynamic characteristics of the transmission system. Euler method: A first-order scheme with truncation error of O(h2), which requires impractically small time steps (h < 10−5 s) to capture high-frequency gear meshing vibrations (100–500 Hz). This leads to excessive computation time and potential numerical instability for long-duration simulations (e.g., 100 s of wind loading). Adams-Bashforth method: A multi-step scheme with higher accuracy (O(h4) for the 4th-order variant) but dependent on historical solution data. This makes it less adaptable to abrupt wind torque changes (e.g., gusts), as it cannot adjust instantly to new load conditions.
Inertia: Gear rotational inertia is inherently included in the SOLID186 element mass matrix; no additional lumped inertia is required.Damping: Rayleigh damping is applied, with coefficients derived from modal analysis (matches 2% damping ratio at dominant natural frequencies). Using the average engagement stiffness of the system to replace the time-variable engagement stiffness of the gear, the first and second level of the planetary wheel vibration state is the same; Planet wheel vibration mode: only a torsion vibration of the planetary wheel of a certain level occurs, The planetary frame and solar wheel in this stage gear are not without vibration, And the algebraic sum of the vibration coordinate components is 0, And the natural frequency of the front row is lower than that in the rear row, The reason is that the inertia of rotation of the first planetary wheel is greater than that of the second planetary wheel; Parallel axis stage torsional vibration mode: the system only parallel axis level torsional vibration, No other components of the system; The vibration of only the first stage: only the first stage, And the vibration state of the planetary wheel is the same. Inside the wind turbine growth box is transferred through the mesh of the gear pair. This chapter analyses the strength analysis of the gear pair through the finite element method. Gear analysis is first a contact analysis, two methods for contact analysis: analytical and numerical methods, Since gear engagement is a contact nonlinear behaviour, In the traditional analytic method calculation, The contact strength calculation is based on the Hertz theory of pair pressure of parallel cylinders, During the calculation process, the original Hz formula needs to deform and modify the coefficients, But the actual tooth condition is much more complex than the Hertz formula, Such as the time-varying engagement stiffness during engagement, Change of the radius of curvature of the tooth profile surface, Loads are generally not uniformly distributed along the contact line, This makes the formula for the relevant contact strength theoretically simplified, This cannot accurately reflect the changes of stress and strain during gear engagement. Time-varying gear meshing stiffness is recalculated at each RK4 sub-step using the instantaneous meshing angle (derived from component rotational speeds). This ensures the stiffness matrix aligns with the dynamic load state.
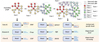 |
Fig. 4 Dynamic response characteristic analysis diagram. |
5 Experimental analysis
The engagement force between the gear pairs decreases from the low-speed wheel to the medium speed wheel to the high-speed wheel, and the engagement force between the gear pairs gradually decreases. Figure 5 shows the analysis diagram of the meshing force change. Meshing force changes of low-speed, medium-speed, and high-speed gear pairs under stochastic wind loads. The x-axis represents time (s), and the y-axis represents meshing force (N). The blue curve denotes the low-speed gear pair, the red curve denotes the medium-speed gear pair, and the green curve denotes the high-speed gear pair. It can be observed that the meshing force gradually decreases from the low-speed stage to the high-speed stage.
Element type: SOLID186 (3D 20-node hexahedral elements) for gear bodies, chosen for high accuracy in capturing bending and contact-induced stress gradients. Tooth fillets (critical stress concentration regions) are meshed with refined elements (element edge length = 0.5 mm) to ensure stress calculation precision. Contact definition: Nonlinear frictional contact pairs composed of CONTA174 (contact elements) and TARGE170 (target elements). Key contact parameters include: friction coefficient = 0.1 (typical for lubricated gear interfaces), augmented Lagrangian contact algorithm, and automatic contact stiffness updating to handle tooth engagement/disengagement.
The action of random wind load and high frequency response caused by internal excitation caused by the coupling of the system, and the initial response will gradually disappear due to the damping of the system. Figure 6 is the evaluation diagram of the transmission chain system. Transient acceleration response of the transmission chain system under combined external wind load and internal excitation. The x-axis is time (s), and the y-axis is acceleration (m/s2). The color map indicates the acceleration magnitude, with darker red representing higher acceleration. The initial transient response decays over time due to system damping.
The displacement of the torsion vibration angle of each component in the system is symmetrical, especially in the previous two-stage planetary wheel system, which is consistent with the actual vibration response, further demonstrating the correctness of the dynamic response of the system. Figure 7 shows the evaluation diagram of torsional vibration angular displacement. Angular displacement distribution of each component in the transmission chain. The x-axis lists the components (hub, low-speed shaft, stage 1 planetary gear, etc.), and the y-axis is angular displacement (rad). The symmetrical distribution of angular displacement in the first two-stage planetary gear system is consistent with actual vibration characteristics.
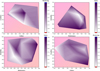 |
Fig. 5 Meshing force variation of gear pairs. |
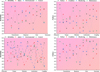 |
Fig. 6 Transmission chain dynamic response evaluation. |
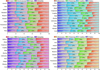 |
Fig. 7 Torsional vibration angular displacement assessment. |
6 Discussion
The pure torsional model adopted in this study is justified by the ratio of radial bearing stiffness to torsional stiffness exceeding 10, which minimizes the coupling effect between torsional and bending/axial vibrations. However, for large-scale wind turbines (rotor diameter > 100 m), the increased structural flexibility may enhance the influence of bending and axial modes, especially under extreme wind conditions (e.g., gusts with wind speed >25 m/s). In such cases, the pure torsional model may underestimate the dynamic load on the shaft and gearbox. Future studies could adopt a coupled torsional-bending-axial model to improve prediction accuracy for ultra-large wind turbines.
For modal analysis, the average meshing stiffness is used instead of the fully time-varying stiffness to simplify the calculation while maintaining the main dynamic characteristics of the system. The time-varying meshing stiffness is dominated by the periodic change in the number of meshing teeth, and its average value can effectively reflect the overall stiffness level of the gear pair.
7 Conclusion
The mathematical model comprehensively considered the external random change excitation, gear pair, time-varying mesh damping, time-varying mesh error between the gear pair, and the stiffness and damping of shaft parts, because the establishment of this model comprehensively considered the external and internal time-varying excitation. In the case of time-variable external load, using the Rungekutta method, the Matlab write calculation program to solve the torsion of each component of the transmission chain vibration displacement, time-variable vibration speed, between the gear, and then according to the vibration image data. Transient dynamic analysis of gear is a method used to determine the dynamic response of gear under any load over time. The transient dynamic analysis is more complicated than the static analysis, so the transient dynamic analysis occupies more computer resources. In addition, the transient dynamic analysis of gear in this paper is first a strong nonlinear analysis, so the time consumed in the calculation process is longer. The maximum stress value is 667 MPa. The wind turbine diameter is 85 m, low speed shaft length is 3800 mm, hub diameter is 2450 mm, tip speed ratio is 5.7, rated speed is 19 r/min, maximum wind energy utilization coefficient is about 0.43, generator rated speed is 1800 r/min, growth box growth ratio is 94.7.
Funding
This work was sponsored in part by China Yangtze Power Co., Ltd. (Z532302051).
Conflicts of interest
Authors declare that they have no competing financial or personal interests.
Data availability statement
Data sharing is not applicable to this article. The dataset associated with this research is not publicly available due to the privacy and confidentiality commitments made to the study participants. Ensuring the protection of respondent privacy was of utmost importance in this research, and as such, the raw data cannot be made openly accessible.
Author contribution statement
Dinghua Yang and Guohan Zhao conceptualized the study and developed the methodology. Zhiyong Shen, Renqiang Wen, Songxiong Wu, and Weipeng Li performed the investigation and data curation. Dinghua Yang conducted the formal analysis and visualization. The original draft was written by Dinghua Yang and Zhiyong Shen, and all authors reviewed and edited the manuscript. Zhiyong Shen supervised the project and acquired funding. All authors have read and agreed to the published version of the manuscript.
References
- B.D. Altan, G.S. Gultekin, Investigation of performance enhancements of savonius wind turbines through additional designs, Processes 11, 23 (2023) [Google Scholar]
- L.N. Azadani, Vertical axis wind turbines in cluster configurations, Ocean Eng. 272, 13 (2023) [Google Scholar]
- H. Badihi, Y.M. Zhang, B. Jiang, P. Pillay, S. Rakheja, A comprehensive review on signal-based and model-based condition monitoring of wind turbines: fault diagnosis and lifetime prognosis, Proc. Ieee 110, 754–806 (2022) [Google Scholar]
- A. Bledzki et al., Reusing and recycling of composite wind turbine blades. A review of current practices and prospects. Part 3**. Various proposals offered by small and middle companies, Przem. Chem. 103, 241–250 (2024) [Google Scholar]
- A. Bledzki et al., Reusing and recycling of composite wind turbine blades. A review of current practices and prospects. Part 2**. Industrial activities, Przem. Chem. 103, 234–240 (2024) [Google Scholar]
- A. Bledzki et al., Reusing and recycling of composite wind turbine blades. A review of current practices and prospects. Part 1. Academic research, Przem. Chem. 103, 225–233 (2024) [Google Scholar]
- R. Bontempo, M. Manna, Diffuser augmented wind turbines: review and assessment of theoretical models, Appl. Energy 280, 17 (2020) [Google Scholar]
- M. Bosnjakovic, M. Katinic, R. Santa, D. Maric, Wind turbine technology trends, Appl. Sci. −Basel 12, 19 (2022) [Google Scholar]
- Z. Cao, S.J. Li, C.P. Li, P.N. Li, T.J. Ko, Formation mechanism and detection and evaluation methods as well as repair technology of crack damage in fiber-reinforced composite wind turbine blade: a review, Int. J. Adv. Manuf. Technol. 120, 5649–5672 (2022) [Google Scholar]
- A. Dhanola, H.C. Garg, Tribological challenges and advancements in wind turbine bearings: a review, Eng. Fail. Anal. 118, 29 (2020) [Google Scholar]
- H. Díaz, C.G. Soares, Review of the current status, technology and future trends of offshore wind farms, Ocean Eng. 209, 21 (2020) [Google Scholar]
- D.H. Didane, M.R. Behery, M. Al-Ghriybah, B. Manshoor, Recent progress in design and performance analysis of vertical-axis wind turbines-a comprehensive review, Processes 12, 33 (2024) [Google Scholar]
- S.H. Ding, C.C. Yang, S. Zhang, Acoustic-signal-based damage detection of wind turbine blades-a review, Sensors 23, 32 (2023) [Google Scholar]
- Y. Du, S.X. Zhou, X.J. Jing, Y.P. Peng, H.K. Wu, N.M. Kwok, Damage detection techniques for wind turbine blades: a review, Mech. Syst. Signal Process. 141, 23 (2020) [Google Scholar]
- N.M.A. Freire, A.J.M. Cardoso, Fault detection and condition monitoring of PMSGs in offshore wind turbines, Machines 9, 26 (2021) [Google Scholar]
- Z.W. Gao, X.X. Liu, An overview on fault diagnosis, prognosis and resilient control for wind turbine systems, Processes 9, 19 (2021) [Google Scholar]
- J.R. Hong, A. Abraham, Snow-powered research on utility-scale wind turbine flows, Acta Mech. Sinica 36, 339–355 (2020) [Google Scholar]
- D.R. Houck, Review of wake management techniques for wind turbines, Wind Energy 25, 195–220 (2022) [Google Scholar]
- K. Jahani, R.G. Langlois, F.F. Afagh, Structural dynamics of offshore wind turbines: a review, Ocean Eng. 251, 17 (2022) [Google Scholar]
- T.W. Kang, J.H. Yun, H.J. Noh, E.S. Kim, H.I. Yang, Analysis of contribution of full summation hydrodynamic load to dynamic response of floating offshore wind turbine structure operating in extreme environments, Int. J. Precis. Eng. Manuf. −Green Technol. 10, 547–565 (2023) [Google Scholar]
- R. Kumar et al., Damage detection of wind turbine system based on signal processing approach: a critical review, Clean Technol. Environ. Policy 23, 561–580 (2021) [Google Scholar]
- R. Kumar et al., A review on transverse flux permanent magnet machines for wind power applications, IEEE Access 8, 216543–216565 (2020) [Google Scholar]
- T. Kunakote et al., Comparative performance of twelve metaheuristics for wind farm layout optimisation, Arch. Comput. Methods Eng. 29, 717–730 (2022) [Google Scholar]
- X.Y. Liu, Z.M. Zhang, F.W. Meng, Y. Zhang, Fault diagnosis of wind turbine bearings based on CNN and SSA-ELM, J. Vib. Eng. Technol. 11, 3929–3945 (2023) [Google Scholar]
- Z.P. Liu, L. Zhang, A review of failure modes, condition monitoring and fault diagnosis methods for large-scale wind turbine bearings, Measurement 149, 22 (2020) [Google Scholar]
- M. Masoumi, Machine learning solutions for offshore wind farms: a review of applications and impacts, J. Mar. Sci. Eng. 11, 40 (2023) [Google Scholar]
- A.H.I. Mourad, A. Almomani, I.A. Sheikh, A.H. Elsheikh, Failure analysis of gas and wind turbine blades: a review, Eng. Fail. Anal. 146, 35 (2023) [Google Scholar]
- V.V. Namboodiri, R. Goyal, Benchmarking the darrieus wind turbine configurations through review and data envelopment analysis, Clean Technol. Environ. Policy 25, 2123–2155 (2023) [Google Scholar]
Cite this article as: Dinghua Yang, Guohan Zhao, Zhiyong Shen, Renqiang Wen, Songxiong Wu, Weipeng Li, Patrice Salzenstein, Simulation analysis of transmission chain dynamic response of wind turbine, Int. J. Simul. Multidisci. Des. Optim. 17, 5 (2026), https://doi.org/10.1051/smdo/2025033
All Figures
|
Fig. 1 Vibration model for wind turbine transmission chain. |
| In the text | |
|
Fig. 2 Dynamics analysis schematic of wind turbine transmission chain. |
| In the text | |
|
Fig. 3 Inherent characteristics analysis of transmission chain system. |
| In the text | |
|
Fig. 4 Dynamic response characteristic analysis diagram. |
| In the text | |
|
Fig. 5 Meshing force variation of gear pairs. |
| In the text | |
|
Fig. 6 Transmission chain dynamic response evaluation. |
| In the text | |
|
Fig. 7 Torsional vibration angular displacement assessment. |
| In the text | |
Current usage metrics show cumulative count of Article Views (full-text article views including HTML views, PDF and ePub downloads, according to the available data) and Abstracts Views on Vision4Press platform.
Data correspond to usage on the plateform after 2015. The current usage metrics is available 48-96 hours after online publication and is updated daily on week days.
Initial download of the metrics may take a while.