")
")
| Issue |
Int. J. Simul. Multidisci. Des. Optim.
Volume 13, 2022
Advances in Modeling and Optimization of Manufacturing Processes
|
|
|---|---|---|
| Article Number | 19 | |
| Number of page(s) | 8 | |
| DOI | https://doi.org/10.1051/smdo/2022008 | |
| Published online | 28 July 2022 | |
Research Article
Optimization of drilling process variables using taguchi technique for LM6 aluminium alloy
Vel Tech Rangarajan Dr. Sagunthala R&D Institute of Science and Technology, Avadi, Chennai, India
* e-mail: This email address is being protected from spambots. You need JavaScript enabled to view it.
Received:
6
January
2022
Accepted:
9
May
2022
Abstract
The abrasive characteristics of LM6 alloys are difficult to machine, so designing a technology that allows for effective machining is essential. This paper aims to evaluate the effect of process variables, namely feed rate, spindle speed and drill material, towards the responses like Thrust force, Surface roughness and burr height when drilling of LM6 alloy. LM6 aluminium alloy was fabricated by the stir casting process. Experiments were conducted using L9 orthogonal array in a Vertical Machining Centre coupled with a dynamometer for measuring thrust force. Surface roughness was found by Surface roughness tester and burr height was measured using Vision Measuring System. The findings show that the created model can accurately estimate the thrust force (TF), surface roughness (SR) and burr height (BH) in LM6 alloy drilling within the parameters examined.
Key words: Optimization / Taguchi technique / LM6 alloy / orthogonal array / drilling / thrust force
© S.R. Charles et al., published by EDP Sciences, 2022
 This is an Open Access article distributed under the terms of the Creative Commons Attribution License (https://creativecommons.org/licenses/by/4.0), which permits unrestricted use, distribution, and reproduction in any medium, provided the original work is properly cited.
1 Introduction
Aluminium (Al) is a desirable metal of higher importance in wider applications in automobiles, construction fields, electrical, public transport and aerospace industries. In the automobile industry, it has been estimated that aluminium in a car will be increased to 250 kg in 2025, compared to 35 kg in the 1970s. Besides, 80% of the weight of an aircraft is made up of aluminium [1]. In aerospace industries, the entry of composite materials has restricted the contribution of Al in airframe designs. However, characteristics such as low resistance to impact and complex mechanical behavior resulting from environmental features are challenging for composite [2]. Because of their manufacturing processes, superior resistance to corrosion, lightweight and lower cost compared to other materials, aluminium alloys are still employed as structural materials in aircraft industries today [3]. Metal matrix composites (MMC) are gaining popularity in various fields; however, they have poor machinability due to their highly abrasive nature [4]. Drilling is required for nearly 75% of the parts; therefore, it is unavoidable machining process [5]. Drilling using a twist drill is the most effective technique in the aerospace sector, as many holes are necessary for the assembly processes of an aircraft, notably in the manufacturing of riveted and bolted components [6]. During aircraft service, these structures are subjected to continual shock and vibration, leading to fatigue failure [7].
Additionally, the holes are drilled using pneumatic drilling equipment that feeds into the aircraft's fuselage skin. During drilling, the chisel edge cuts the material and the chips are trapped in the flutes, which generates strong thrust force, making effective heat dissipation difficult [8]. Heat is generated by the drill's friction with the chip, which leads to poor surface finish and, as a result, forms stress concentration zones [9]. As a result, the aerospace industry's demanding hole quality measurements provide a considerable difficulty for drilling in aeronautical constructions [10,11]. The thrust force (TF), surface roughness (SR) and burr height (BH) in drilling LM6 alloy with HSS, Carbide and TiN-coated carbide drills are all evaluated in this article. Taguchi's orthogonal array is used in the experiments. The validity of the model is checked using ANOVA. The findings show that the created model can accurately estimate the TF, SR and BH in LM6 alloy drilling within the parameters examined. In this study, the effect of process variables on hole quality in drilling is investigated.
2 Materials and methods
2.1 Materials
The material utilized in this research is chosen exclusively for its quality, affordability and utility. LM6 alloy is difficult to machine due to the presence of high silicon content and its dragging tendency. Under normal and marine conditions, the aluminium alloy (LM6) provides optimum protection. Table 1 reveals the constituents of the LM6 Al alloy using Optical Emission Spectrometry (ASTM E 1251-07).
Elemental constituents of aluminium alloy (LM6).
2.2 Fabrication of LM6 alloy
LM6 Al alloy was prepared using the stir casting method in the form of plates with the dimension of 100 × 100 × 10 mm. Stir casting has several advantages, including ease to use, low-cost production, homogenous distribution of reinforcement particles, and superior mechanical properties [12,13]. An electric furnace was used to melt LM6 alloy ingots using a graphite coated crucible. The temperature was gradually increased to 850 °C. Hexa chloro ethane was used to degas the melt at 800 °C. Then the slurry was stirred at 600 rpm for 10 min and poured into pre-heated (650 °C) cast-iron moulds. The experimental setup for Stir casting is shown in Figure 1.
 |
Fig. 1 Stir casting set-up. |
2.3 Drilling
The drilling operation was performed in the LM6 cast alloy using Vertical Machining Center. Data from experiments are captured and recorded using a computer-based data collecting device. The Kistler dynamometer is employed to find the TF. Figures 2 and 3 show photographs of the drill bits and VMC that were used in this study.
The surface roughness measurement is essential for several basic problems like friction, surface deformation, heat transfer and electrical current, stiffness of joints and spatial precision. Figure 4 shows the surface roughness tester used for this research (Marsurf PS1) to evaluate the surface roughness. Burr is formed at the hole's exit by the plastic deformation of the material. Burrs cause many problems with product quality and performance because they can connect with component assembly and create the jamming effect. A lot of articles have therefore concentrated their research on exit burr. Its magnitude can describe the height and thickness of the burr. Figure 5 displays the Vision Measuring System used for burr height measurement.
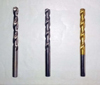 |
Fig. 2 Photograph of drill bits. |
 |
Fig. 3 Photograph of VMC. |
 |
Fig. 4 Surface roughness tester. |
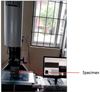 |
Fig. 5 Vision measuring system |
2.4 Design of experiments (DoE)
Taguchi method is used in manufacturing engineering to evaluate and model experimental results. It is used to analyze the critical effects and interactions. It is an effective tool for determining optimal cutting parameters, providing a quick, efficient and systematic approach. This method dramatically eliminates the experiments needed to model the response functions compared to the conventional approach to experimentation. DoE techniques are employed to convert the standard design to a robust one. The experiment's goal is to establish the parameters that influence drilling operation to attain the lowest TF, SR and BH. The experiment was designed using a L9 orthogonal array to study the effects of drilling process variables. In the present work, three variables with three levels each are used. Table 2 shows the process parameters and their levels.
Process parameters and their levels.
3 Results and discussions
The effect of process variables such as feed rate (F), spindle speed (S) and drill material (D) of LM6 alloy on various responses namely TF, SR and BH were studied and are shown in Table 3.
Optimal level of machining parameters for responses are observed at a level in which each variable has the most significant S/N ratio [14]. It is evident from Figures 6–8 and Table 4 that the parameters TF, SR and BH are found to be lower at the first level of feed rate (F1), third level of spindle speed (S3) and second level of drill material (D2). Consequently, the variants of F1S3D2 (F1 = 50 mm/min, S3 = 3000 rpm, D2 = Carbide drill) are found to be more optimum for the smallest TF, SR and BH within the chosen variables examined.
ANOVA is employed to optimize process variables by checking the relative role of variables in terms of how it contributes to the response. The evaluation process carried out was analyzed at a 95 percent confidence level. Table 5 provides the findings of ANOVA for TF, SR and BH. The p-value is lesser than 0.05 for feed rate, which shows that the factor has a significant effect on thrust force, whereas the p-value is smaller than 0.05 for F and S, which shows that F and S have a major impact on SR and BH. Apart from the p-value, Fisher's F-test was used to describe the process variables. F-Table value at 5% significance level for thrust force and surface roughness is (F 0.05, 2, 4 = 6.94). From Table 4, it is revealed that feed rate has more influence on TF. It is also noticed that Feed rate and Spindle speed are statistically important and have a major impact on SR. The tabulated F-value for burr height is (F 0.05, 2, 2=19). F-values for feed and speed are larger than F-table value, which states that they have a major impact on the burr height, whereas F-test value for drill material is smaller than F- table value which shows that it does not possess any impact on burr height.
From ANOVA Table 5, the feed rate is influencing more on TF and BH. Spindle speed has the most influence on SR. It is also seen that with the help of the ANOVA table, the Feed rate has the most contribution of TF (78.58%) and BH (44.89%), whereas the contribution of spindle speed (76.59%) is high for SR.
Experimental results and S/N values − TF, SR and BH.
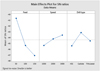 |
Fig. 6 Response graphs for thrust force. |
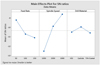 |
Fig. 7 Response graphs for surface roughness. |
 |
Fig. 8 Response graphs for burr height. |
Response table S/N ratio − TF, SR and BH.
ANOVA table − TF, SR and BH.
3.1 Confirmation experiments
In order to validate the Experimental results, confirmation experiments were successfully conducted based on the optimum combination of factors affecting TF, SR and BH. The results of Confirmation experiments are shown in Table 6. A strong agreement can be found between the predicted value & the experimental value and the error is less than 5 %.
Results of confirmation experiments.
4 Effect of process variables on responses
4.1 Effect of process variables on thrust force
The main factor influencing the thrust forces is Feed (F) [15]. An increase in F from 50 mm/min to 150 mm/min increases TF for the prepared specimen LM6 alloy. This is because; larger the F increases the load on the drill bit, which increases the TF [16]. The influence of Feed rate on TF is illustrated in Figure 9. As the spindle speed increases, TF decreases; that is, TF at 3000 rpm is lesser than 2000 rpm and 1000 rpm. In this research, three different drill bit materials were used, and varying results were obtained. The Carbide drill bit is good enough for machining LM6 aluminium alloy.
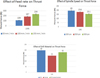 |
Fig. 9 Effect of process variables on thrust force. |
4.2 Effect of process variables on surface roughness
Increase of F from 50 mm/min to 150 mm/min, Surface roughness also increases linearly. It is seen that lower F gives lower thrust force which implies that surface finish is good at a lower feed rate. As spindle speed increases, cutting time is reduced, resulting in reduced thrust force and reduced work piece distortion, and hence, surface finish is improved. Figure 10 reveals that the carbide drill bit gives minimum surface roughness for the LM6 aluminium alloy.
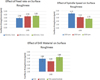 |
Fig. 10 Effect of process variables on surface roughness. |
4.3 Effect of process variables on burr height
From Figure 11, it is noticed that increasing F from 50 mm/min to 150 mm/min exit burr also increases for LM6 alloy. It is also seen that BH decreases lead to an increase in spindle speed for LM6 alloy, and the carbide drill bit gives minimum BH.
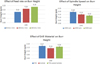 |
Fig. 11 Effect of process variables on burr height. |
5 Conclusions
The effect of drilling process variables on aluminium matrix composites led to the following conclusions.
-
The LM6 Aluminium alloy was successfully produced using stir casting process.
-
Feed rate (78.58%) influences Thrust Force and Burr height (44.89%).
-
Spindle speed (76.59%) has the most significant influence on Surface roughness compared to feed rate and drill material.
-
Confirmation experiments reveal that the responses have a small margin of error.
References
- M. Aamir, K. Giasin, M. Tolouei-Rad, A. Vafadar, J. Mater. Res. Technol. 9 , 12484–12500 (2020) [CrossRef] [Google Scholar]
- E.A. Starke Jr, J.T. Staley, Woodhead Publishing, Cambridge, 2011, pp. 747–783. [Google Scholar]
- T. Dursun, C. Soutis, Mater. Des. 100 , 862–871 (2014) [CrossRef] [Google Scholar]
- K. Palanikumar, A. Muniaraj, Measurement 53 , 240–250 (2014) [CrossRef] [Google Scholar]
- C. Sarala Rubi, J. Udaya Prakash, C. Rajkumar, IOP Conf. Series: Mater. Sci. Eng. 912 , 1–12 (2020) [Google Scholar]
- M. Aamir, M. Tolouei-Rad, K. Giasin, A. Nosrati, Int. J. Adv. Manufactur. Technol. 105 , 2289–2308 (2019) [CrossRef] [Google Scholar]
- D. Sun, P. Lemoine, D. Keys, P. Doyle, S. Malinov, Q. Zhao, X. Qin, Y. Jin, Int. J. Adv. Manufactur. Technol. 94 , 1719–1726 (2018) [CrossRef] [Google Scholar]
- R. Iyer, P. Koshy, E. Ng, Int. J. Mach. Tools Manufact. 47 , 205–210 (2007) [CrossRef] [Google Scholar]
- W. Gu, H. Xu, J. Liu, Z. Yue, Tsinghua Sci. Technol. 14 , 54–57 (2009) [CrossRef] [Google Scholar]
- K. Giasin, S. Ayvar-Soberanis, Compos. Struct. 159 , 745–760 (2017) [CrossRef] [Google Scholar]
- M. Aamir, S. Tu, M. Tolouei-Rad, K. Giasin, A. Vafadar, Materials 13 , 1–17 (2020) [Google Scholar]
- J. Udaya, T.V. Moorthy, S. Ananth, Appl. Mech. Mater. 612 , 157–162 (2014) [CrossRef] [Google Scholar]
- C. Sarala Rubi, J. Udaya Prakash, INCAS Bull. 12 , 167–174 (2020) [Google Scholar]
- C. Sarala Rubi, J. Udaya Prakash, INCAS Bull. 12 , 173–182 (2020) [CrossRef] [Google Scholar]
- S. Basavarajappa, G. Chandramohan, J.P. Davim, M. Prabu, K. Mukund, M. Ashwin, M. Prasanna Kumar, Int. J. Adv. Manufactur. Technol. 35 , 1244–1250 (2008) [CrossRef] [Google Scholar]
- M. Ramesh, A. Gopinath, IOP Confer. Ser. : Mater. Sci. Eng. 197 , 1–7 (2017) [Google Scholar]
Cite this article as: Sarla Rubi Charles, Udaya Prakash Jayavelu, Rajkumar Chinnaraj, Sachin Salunkhe, Optimization of drilling process variables using taguchi technique for LM6 aluminium alloy, Int. J. Simul. Multidisci. Des. Optim. 13, 19 (2022)
All Tables
All Figures
|
Fig. 1 Stir casting set-up. |
| In the text | |
|
Fig. 2 Photograph of drill bits. |
| In the text | |
|
Fig. 3 Photograph of VMC. |
| In the text | |
|
Fig. 4 Surface roughness tester. |
| In the text | |
|
Fig. 5 Vision measuring system |
| In the text | |
|
Fig. 6 Response graphs for thrust force. |
| In the text | |
|
Fig. 7 Response graphs for surface roughness. |
| In the text | |
|
Fig. 8 Response graphs for burr height. |
| In the text | |
|
Fig. 9 Effect of process variables on thrust force. |
| In the text | |
|
Fig. 10 Effect of process variables on surface roughness. |
| In the text | |
|
Fig. 11 Effect of process variables on burr height. |
| In the text | |
Current usage metrics show cumulative count of Article Views (full-text article views including HTML views, PDF and ePub downloads, according to the available data) and Abstracts Views on Vision4Press platform.
Data correspond to usage on the plateform after 2015. The current usage metrics is available 48-96 hours after online publication and is updated daily on week days.
Initial download of the metrics may take a while.