")
")
| Issue |
Int. J. Simul. Multidisci. Des. Optim.
Volume 13, 2022
Advances in Modeling and Optimization of Manufacturing Processes
|
|
|---|---|---|
| Article Number | 16 | |
| Number of page(s) | 9 | |
| DOI | https://doi.org/10.1051/smdo/2022004 | |
| Published online | 15 March 2022 | |
Research Article
Selection of raw material supplier for cold-rolled mild steel manufacturing industry
School of Mechanical and Civil Engineering, MIT Academy of Engineering, Alandi, Pune 412105, India
* e-mail: This email address is being protected from spambots. You need JavaScript enabled to view it.
Received:
15
March
2021
Accepted:
11
February
2022
Abstract
Appropriate supplier selection is important in success of every manufacturing industry. Improper supplier selection causes an adverse impact on functioning and development of any organization. Evaluating available suppliers and selecting most suitable supplier is very important task of procurement management. Theses selection problems can be solve using decision making methods. These methods are used to find most preferred alternative from given set of alternatives based on different attributes. The aim of the present work is to select raw material supplier for cold-rolled mild steel manufacturing industry using selected three decision making methods such as complex proportional assessment, operational competiveness rating analysis and preference selection index, etc. The selection is made among five suppliers based on five attributes viz: performance rating, productivity, yield, cost and lead time. The analytical hhierarchy process is used for determining weight of the attributes based on relative importance of each attribute which can have a great impact on the final solution. It is found from the ranks obtained using selected three methods that supplier S1 is best and supplier S5 is worst among the others alternatives. It is also observed that the rankings of suppliers has some deviations in the rankings due to different mathematical approaches used in these three selected methods. The proposed methods help to evaluate and rank different raw material suppliers for manufacturing industries.
Key words: Decision making methods / complex proportional assessment / operational competiveness rating analysis / preference selection index
© A.G. Kamble et al., Published by EDP Sciences, 2022
 This is an Open Access article distributed under the terms of the Creative Commons Attribution License (https://creativecommons.org/licenses/by/4.0), which permits unrestricted use, distribution, and reproduction in any medium, provided the original work is properly cited.
1 Introduction
Selection of an appropriate supplier is very important component of procurement management for every manufacturing industry. It directly affects productivity and efficiency of any manufacturing company. It is important to make the right decision when selecting a supplier because the optimal choice ensures lowest cost and higher quality of product itself [1]. Therefore, the selection of one or more supplier from set of available is an important and difficult task for decision makers [2]. Thus, selection of an appropriate supplier is considered as a multi-attribute decision making (MADM) problem which consists of different attributes that are quantitative, qualitative and conflicting in nature.
These MADM methods are used to solve such selection problems with different number of conflicting attributes. It is widely used decision making methods to solve supplier selection problem. It uses different kinds of techniques to identify best alternative from given set of alternatives. In order to apply these techniques to different applications, evaluation parameters are required [3]. The companies are facing complex issues related to supplier selection, therefore appears to be reluctant in implementing the performance based rankings to the suppliers. There are always conflicts and fair competiveness between supply quality and supply chain management. Hence, it is important to identify the suppliers that can fulfill the interests of the organization. Ranking the suppliers becomes important to maintain the quality. In the present work, attempt has been made to select the most appropriate supplier using decision making methods that can be applied within the stipulated constraints.
2 Literature review
Many researchers are working in the field of selection problems. The various literatures is available on the implementation of decision making methods for selection among multiple alternatives and attributes. In this section, some studies that uses on some decision making methods in selection problems are reviewed.
Chatterjee and Chakraborty [4] applied complex proportional assessment (COPRAS) and additive ratio assessment (ARAS) methods in order to solve a gear material selection problem for a given manufacturing firm. Surface hardness, core hardness, surface fatigue limit, bending fatigue limit and ultimate tensile strength were considered as attributes for gear material selection. The ranking performances of gear materials obtained by these two methods were compared with that of TOPSIS method used by previous researchers for gear material selection. Madic et al. [5] presented COPRAS method in order to solve supplier selection problem for an agricultural and construction equipment's manufacturing firm. The rankings of supplier alternatives obtained by COPRAS method were compared with rankings obtained by the past researchers. Various attributes considered for selection of supplier were price, quality, delivery performance, distance and supply variety. Popovic et al. [6] worked on investment project selection problem using COPRAS and COPRAS-G methods based on financial analysis attributes and use of imprecise data, Pay Back Period, Net Present Value, Internal Rate of Return, Profitability Index and Risk level of project were considered as attributes for project selection and then the best project from the available was selected by using COPRAS and COPRAS-G methods. Adali and Tusisik [7] used COPRAS and ARAS methods to solve the problem of air conditioner selection. The rankings of air conditioner alternatives obtained by these two methods were compared with respect to each other in order to select best air conditioner alternative. Energy Efficiency Ratio, Coefficient of Performance, presence of ionizer, cost, and maximum sound level (indoor), maximum sound level (outdoor), watts consumption for heating and watts consumption for cooling were considered as attributes for air conditioner selection. Papic et al. [8] worked on application of COPRAS method for choosing the best compact fluorescent lamp from the set of available lamps. Different attributes considered for selection of lamp were brightness, active power, total apparent power, price and life of lamp.
Stanujkic et al. [9] proposed improved Operational Competiveness Rating Analysis (OCRA) method in his paper. The OCRA method was improved using interval grey numbers. In addition to this the original normalization procedure has been replaced by new one. The usability and effectiveness of a proposed approach are checked on two numerical illustrations. In the first one improved OCRA method is used for the selection of the contractors for the construction of prefabricated wooden shield-shaped houses. In the second one, the usability and efficiency of the improved OCRA method are verified in the case of the selection of the best capital investment project. Ozdagoglu and Cirkin [10] worked on the electronic device selection in industrial product and machinery industry with OCRA method. The purchase decisions of electronic device alternatives are being analysed with OCRA method. The importance level of evolution criteria for purchase are obtained out of 100 points. These importance levels are then being used in OCRA method in an attempt to evaluate various electronic device alternatives. Madic et al. [11] used OCRA method in order to solve non-conventional machining process problems. Three case studies are solved for selection of most suitable non-conventional machining process. The rankings obtained by OCRA method showed good correlation with the rankings obtained by previous researchers. The various attributes used for selection of non-conventional machining process were tolerance and surface finish, material removal rate, power requirement, cost, shape factor and work material type. Kundakçi [12] researched on evaluation of supplier with the help of EATWOS (Efficiency analysis technique with output satisfying) and OCRA (operational competitiveness rating analysis) method. The rankings of the suppliers were determined based on efficiency score and then results are compared.
Kumar and Kumar [13] prepared a ceramic particulate (SiO2/sic) reinforced AA2024 alloy composite material formulation. Preference selection index (PSI) method had been used to rank the composite materials of the formulation. This enables a practicing engineer to rank the designed materials via optimizing material properties like tensile strength, flexural strength, impact strength, wear resistance, density, etc. It had been observed that the aluminium alloy composite incorporated with an equal presence of both ceramics shows best properties and also ranked highest by PSI method. Madić et al. [14] discussed the application of the PSI method for discrete optimization of the CO2 laser cutting of stainless steel. Roughness of the cut surface, heat affected zone (HAZ), kerf width and material removal rate (MRR) were considered as optimization criteria. However, while applying the PSI method it was observed that it could not be useful in situations where there exist a large number of alternatives which had attribute values (performances) very closed to those which were preferred. Prasad et al. [15] explained the optimization of turning process parameters. The responses of MRR and surface roughness (Ra and Rz) at different combinations of speed, feed depth of cut were optimized using PSI method. The results obtained by using PSI method concluded that the speed at 2000 rpm, feed at 0.4 mm/rev and depth of cut at 0.75 mm were the optimal combination for achieving the higher material removal rate and lowered surface roughness concurrently. Maniya and Bhatt [16] implemented a novel tool to help the decision-maker for selection of a proper material that will meet all the requirements of the design engineers. Three different types of material selection problems were examined. They had concluded that the psi method was logical and more appropriate for the material selection problems.
It is observed from literature review that researchers worked on different types of selection problems using decision making methods however no researcher has worked on selection of raw material supplier for cold-rolled mild steel manufacturing industry using selected method like COPRAS, OCRA and PSI methods. Therefore, present work focus on ranking of suppliers considering the five attributes viz: cost, performance rating, productivity, yield and lead time using selected methods.
3 MADM methods
3.1 COPRAS method
COPRAS method was developed by Zavadskas [10]. This method assumes direct and proportional dependences of the significance and utility degree of available alternatives when mutually conflicting criteria are present. It also considers the performance of the alternatives with respect to different criteria and also the corresponding criteria weights. This method considers both the ideal best and the ideal-worst solutions for selecting the best decision. The COPRAS method which is used here for evaluating and selecting the supplier alternatives uses a stepwise procedure for ranking and evaluating the alternatives in terms of their significance and utility degree.
The steps for COPRAS method are presented as below:
Step 1: Set the initial decision matrix, X. by using following matrix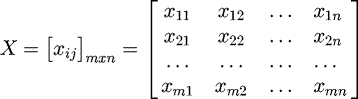 where Xij is the assessment value of ith alternative in respect to jth criterion, m is the number of alternatives and n is the number of criteria.
Step 2: Normalization of the decision matrix by using equation (1). (1)
(1)
Step 3: Determination of the weighted normalized decision matrix, D, by using equation (2). (2)where rij is the normalized performance value of ith alternative on jth criterion and Wj is the weight of jth criterion.
The sum of weighted normalized values of each criterion is always equal to the weight for that criterion: (3)
(3)
Step 4: Calculation of sums of weighted normalized values for both the beneficial and non-beneficial criteria by using equation (4). (4)where y + ij and y − ij are the weighted normalized values for the beneficial and non-beneficial criteria, respectively.
Step 5: Determination the relative significances of the alternatives, Qi, by using equation (5)
 (5)where S-min is the minimum value of S-i.
Step 6: Calculation of the quantitative utility, Ui, for ith alternative by using equation (6). (6)where Qmax is the maximum relative significance value.
As a consequence of equation (6), utility values of the candidate alternatives range from 0% to 100%. The greater the value of Ui, the higher is the priority of the alternative. Based on alternative's utility values a complete ranking of the competitive alternatives can be obtained.
3.2 OCRA method
The preference rating of the alternatives in OCRA method reflect the decision maker's preferences for the criteria. Beside this the main advantage of OCRA method is that it can deal with those MCDM situations when the relative weights of the criteria are dependent on the alternatives and different weight distribution are assigned to the criteria for different alternatives as well as some of the criteria are not applicable to all alternatives. The general OCRA process is described as below.
Step 1. Compute the preference ratings with respect to the non-beneficial criteria. In this step, OCRA method is only concerned with the scores that various alternatives receive for the input criteria without considering the scores received for beneficial criteria. The lower values of non-beneficial or input criteria are more preferable. The aggregate performance of ith alternative with respect to all the input criteria is calculated by using equation (7)
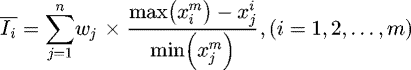 (7)where Īi is the measure of relative performance of ith alternative and xij is the performance score of ith alternative with respect to jth input criteria. If ith alternative is preferred to mth alternative with respect to jth criteria then, xij < xmj.
The term,  indicates the difference in performance scores for criteria j, between ith alternative whose score for criterion j is the highest among all the alternatives considered. The calibration constant wj (relative importance of jth criterion) is used to increase or reduce the impact of this difference on the rating on Īi with respect to jth criterion.
Step 2. Calculate the linear preference rating for input criteria by applying equation (8)
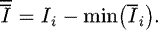 (8)
(8)
This linear scaling is done to assign a zero rating to the least preferable alternative. Ïi represents the aggregate preference rating for ith alternative with respect to the input criteria.
Step 3. Compute the preference rating with respect to beneficial criteria. The aggregate performance for ith alternative on all the beneficial or output criteria is measured using equation (9)
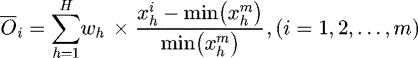 (9)where h = 1, 2, …, n indicates the number of beneficial criteria and Wh is the calibration constant (weight importance) of hth output criteria. The higher alternative's score for an output criterion, the higher is the preference for that alternative.
Step 4. Calculate the linear preference rating for the output criteria by using equation (10)
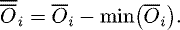 (10)
(10)
Step 5. Compute the overall preference rating.
The overall preference rating for each alternative is calculated by using the sum (Ïi + Öi) so that the least preferable alternative receives rating of zero. The overall preference rating (Pi) is calculated by using equation (11)
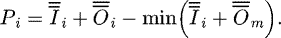 (11)
(11)
The alternatives are ranked according to the values of the overall preference rating.
3.3 PSI method
The PSI method was developed by Maniya and Bhatt [16] as decision making tool for solving the problems related with material selection. PSI method is a systematic scientific method or tool for design Engineers to select the appropriate material for the given application. This method is useful when there is a conflict in deciding the relative importance between attributes and that is the delicateness of PSI method. Using overall preference value, preference selection index (PSI) for each alternative is calculated and then the alternative with higher value of PSI is selected as best alternative.
The steps for PSI method are presented as below:
Step 1: Construct the decision matrix by identifying the objective and shortlisting the possible alternatives with the related criteria values.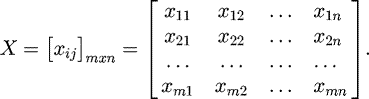
Step 2: Normalize the decision matrix. This step involves transformation of the attribute values into a compatible unitless dimension with a range of 0–1.
For beneficial attributes, normalization is done by using equation (12).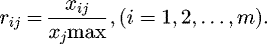 (12)
(12)
For non-beneficial attributes, normalization is done by using equation (13).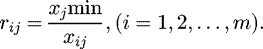 (13)
(13)
Step 3: Compute the preference variation (PVj) value in this step, the preference variation (PVj) value for each attribute is determined by using equation (14). (14)where
 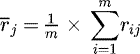 =mean of normalized values of jth attribute.
Step 4: Determine the overall preference value (βj). Under this step, at first, deviation (αj) in preference value (PVj) for each attribute is determined and then, the overall preference value (βj) is evaluated for each attribute by using equation (15)
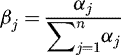 (15)where αj = deviation in preference value for jth attribute =(1 − PVj) and
  .
.
Step 5: Obtain the preference selection index (Pi) for each alternative.
The preference selection index (Pi) for each alternative is computed by applying equation (16)
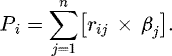 (16)
(16)
After calculating the Pi values, the priorities of the candidate alternatives are determined. The greater the value of Pi, the higher is the priority of the alternative, i.e. an alternative is ranked first whose Pi value is the highest and an alternative is ranked last whose Pi value is the lowest.
4 Problem statement for selection of raw material supplier
Selection of one or more suppliers from the set of available is an important and difficult task for decision makers. In this paper, the raw material supplier selection problem for cold-rolled mild steel manufacturing industry is considered. The problem consists of five alternative suppliers and five selection attributes as performance rating (PR), productivity (P) (in metric ton per hour), yield (Y) (in percentage), cost (C) (in rupees per metric ton) and lead time (LT) (in days). Among these five attributes, the first three are beneficial attributes where higher values are desirable whereas the last two are non-beneficial attributes where smaller values are desirable. Table 1 shows the decision matrix of the problem where the performance of each alternative with respect to each attribute is presented. Weight for each attribute is calculated by using AHP method are shown in Table 2.
Decision matrix.
Weights for the attributes.
5 Solution using MADM methods
5.1 COPRAS method
While solving this supplier selection problem for cold-rolled mild steel manufacturing industry using COPRAS method, firstly the decision matrix is normalized by applying equation (1) as shown in Table 3. The purpose of normalization is to obtain dimensionless values of different attributes so that all of them can be compared with each other. Then the corresponding weighted normalized decision matrix is prepared by using equation (2) as shown in Table 4. Based on equation (4) the sums of the weighted normalized values are calculated for both the beneficial attributes (S + i) and non-beneficial attributes (S − i), as given in Table 5. Then, by applying equation (5) and equation (6), the relative significance or priority value (Qi) and the quantitative utility degree (Ui) for each alternative are calculated, as shown in Table 6.
Normalized decision matrix.
Weighted normalized matrix.
Sums of weighted normalized value.
Qi and Ui values for alternative supplier.
5.2 OCRA method
While solving this supplier selection problem for cold-rolled mild steel manufacturing industry using OCRA method, firstly compute the preference ratings with respect to the non-beneficial criteria. In this step, OCRA method is only concerned with the scores that various alternatives receive for the input criteria without considering the scores received for beneficial criteria. The lower values of non-beneficial or input criteria are more preferable. The aggregate performance of ith alternative with respect to all the input criteria is calculated using equation (7). Then calculate the linear preference rating for input criteria using equation (8). As shown in Table 7. Then compute the preference rating with respect to beneficial criteria using the equation (9). Then calculate the linear preference rating for the output criteria using following equation (10) as shown in Table 8. Finally compute the overall preference rating. The overall preference rating for each alternative is calculated by using equation (11) so that the least preferable alternative receives rating of zero. The overall preference rating (Pi) is calculated as follows. The alternatives are ranked according to the values of the overall preference rating as shown in Table 9.
Linear preference rating for input criteria (Non-beneficial).
Linear preference rating for input criteria (Beneficial).
Overall preference rating.
5.3 PSI method
At the time of solving this supplier selection problem for cold-rolled mild steel manufacturing industry using PSI method, the decision matrix is firstly normalized by applying equations (12) and (13) as shown in Table 10. The purpose of normalization is to obtain dimensionless values of different attributes so that all of them can be compared with each other. Then preference variation value is determined using equation (14) as shown in Table 11. According to preference variation value the overall performance value is determined using equation (15) as shown in Table 12. Finally, the value of preference selection index is achieved using equation (16) as shown in Table 13. After calculation of the preference selection index (Ii) and finally alternatives are ranked to facilitate the managerial interpretation of the results as shown in Table 14.
Normalized decision matrix.
Preference variation value.
Overall preference value.
Preference selection index.
Pi value for alternative supplier.
6 Results and discussion
The present work used three selected decision making methods such as COPRAS, OCRA and PSI are applied to solve supplier selection problem for cold rolled mild steel manufacturing industry. The five alternative suppliers are assessed based on their five attributes. The ranks obtained from selected techniques are given in Table 15 that summarizes ranking performances of supplier obtained by using three selected methods. It is observed that the best supplier is supplier S1 as it has been identified as rank 1 and the worst supplier is supplier S5 as it has been identified as rank 5 among the selected alternatives. It is also observed that the rankings of supplier obtained by COPRAS and OCRA methods are exactly same and the ranking of supplier obtained by PSI method has some deviations in the rankings. The ranking performance comparisons obtained by using three selected methods are shown in Figure 1. The ranking obtained from applied methods can be better visualised and helps the decision maker to assess preferences of the suppliers for cold-tolled mild steel manufacturing industry. Thus, the present work can also help to solve complex selection problems in various industries.
Ranking performances obtained from COPRAS, OCRA and PSI method.
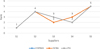 |
Fig. 1 Comparative rankings of suppliers. |
7 Conclusions and future scope
The evaluation of available raw material suppliers and selection of most appropriate supplier is very important decision for any manufacturing industry. The selection of an improper supplier can directly affect productivity and efficiency of any manufacturing industry. Therefore, it is important to make the right decision while selecting a supplier. The decision making methods are applied to solve such supplier selection problems based on different number of attributes. In the present work, three selected decision making methods viz: COPRAS, OCRA and PSI are used for solving raw material supplier selection problem for cold-rolled mild steel manufacturing industry and AHP method is used for determining weight of each attribute. It is found from the ranks obtained using selected three methods that supplier S1 is best and supplier S5 is worst among the others alternatives. It is also observed that the rankings of suppliers has some deviations in the rankings due to different mathematical approaches used in these three selected methods. The ranking of suppliers obtained using COPRAS and OCRA are found to be exactly same and the rankings obtained by PSI has some deviations. Finally, it is concluded that these methods are very helpful for decision makers in order to select the best supplier from the set of available suppliers which can help manufacturing industries to remain competitive in the market by increasing customer satisfaction. The example presented in the present work has demonstrated analytically the computational process of selected methods however analysis is done based on selected five attributes of the materials, it can be further assessed by including more attributes. The problem can be further solved by other decision making methods for improvement and reliability. Also, the selected methods can be employed for making the best decision in the other fields of engineering and management problems.
References
- Ž. Stević, Supplier selection using AHP and COPRAS method, in 21st International Scientific Conference, Doboj, Bosnia and Herzegovina, 2016, pp. 232–237 [Google Scholar]
- S.V. Yadav, H.K. Narang, A.R. Singh, Supplier selection through attractive criteria: A Fuzzy Kano based integrated MCDM approach, in Proceedings of the International Conference on Industrial Engineering and Operations Management Bandung, Indonesia, Raipur Chhattisgarh, India (2018) pp. 1695–1704 [Google Scholar]
- A. Martin, T.M. Lakshmi, V.P. Venkatesan, A study on evaluation metrics for multi criteria decision making (MCDM) methods − TOPSIS, COPRAS & GRA, Int. J. Comput. Algor. 7, 29–37 (2018) [CrossRef] [Google Scholar]
- P. Chatterjee, S. Chakraborty, Gear material selection using complex proportional assessment and additive ratio assessment-based approaches: a comparative study, Int. J. Mater. Sci. Eng. 1, 104–111 (2013) [Google Scholar]
- M. Madić, D. Marković, G. Petrović, M. Radovanović, Application of COPRAS method for supplier selection, in The Fifth International Conference Transport and Logistics, University of Niš (2014) [Google Scholar]
- G. Popović, D. Stanujkić, S. Stojanović, Investment project selection by alying COPRAS method and imprecise data, Serbian J. Manag. 7, 257–269 (2012) [CrossRef] [Google Scholar]
- Yrd. Doç. Dr. Esra AYTAÇ ADALI, Yrd. Doç. Dr. AyĢegül TUġ IġIK, Air Conditioner Selection Problem with COPRAS and ARAS Methods. Manas Journal of Social Studies, Pamukkale University, Denizli, Turkey 5, 125–138 (2016) [Google Scholar]
- M. Vujičić, M. Blagojević, M. Papić, Application of COPRAS MCDM Method for Choosing the Best Compact Fluorescent Lamp. International Scientific Conference, University of Kragujevac 71–74 (2016) [Google Scholar]
- A. Özdağoğlu, E. Çirkin, Electronic device selection in industrial products and machinery industry: comparative analysis with OCRA and MAUT method, Int. J. Contemp. Econ. Admin. Sci. 9, 119–134 (2019) [Google Scholar]
- D. Stanujkic, E. Kazimieras Zavadskas, S. Liu, D. Karabasevic, G. Popovic, Improved OCRA method based on the use of interval grey numbers, J. Grey Syst. 29, 49–60 (2017) [Google Scholar]
- M. Madić, D. Petković, M. Radovanović, Selection of non-conventional machining processes using the OCRA method, Serbian J. Manag. 10, 61–73 (2015) [CrossRef] [Google Scholar]
- N. Kundakçı, A comparative analyze based on EATWOS and OCRA methods for supplier evaluation, J. Oper. Res. Stat. Econometr. Manag. Inf. Syst. 7, 104–112 (2019) [Google Scholar]
- M. Kumar, A. Kumar, Application of preference selection index method in performance-based ranking of ceramic particulate (SiO2/SiC) reinforced AA2024 composite materials, in The Scientific Committee of the International Conference on Materials and Manufacturing Methods, Mechanical Engineering Dept., M.N.I.T., Rajasthan, 2017 [Google Scholar]
- M. Madica, J. Antuchevicieneb, M. Radovanovica, D. Petkovica, Determination of laser cutting process conditions using the preference selection index method, Optics Laser Technol 89, 214–220 (2016) [Google Scholar]
- R. Vara Prasad, Ch. Maheswara Rao, B. Naga Raju, Application of preference selection index (PSI) method for the optimization of turning process parameters, Int. J. Modern Trends Eng. Res 5, 140–144 (2018) [Google Scholar]
- K. Maniya, M.G. Bhatt, A selection of material using a novel type decision-making method: preference selection index method, Mater. Des. 1785–1789 (2009) [Google Scholar]
Cite this article as: Avinash G. Kamble, Pritam S. Kalos, K. Mahapatra, Vishal A. Bhosale, Selection of raw material supplier for cold-rolled mild steel manufacturing industry, Int. J. Simul. Multidisci. Des. Optim. 13, 16 (2022)
All Tables
All Figures
|
Fig. 1 Comparative rankings of suppliers. |
| In the text | |
Current usage metrics show cumulative count of Article Views (full-text article views including HTML views, PDF and ePub downloads, according to the available data) and Abstracts Views on Vision4Press platform.
Data correspond to usage on the plateform after 2015. The current usage metrics is available 48-96 hours after online publication and is updated daily on week days.
Initial download of the metrics may take a while.