")
")
| Issue |
Int. J. Simul. Multidisci. Des. Optim.
Volume 17, 2026
|
|
|---|---|---|
| Article Number | 9 | |
| Number of page(s) | 12 | |
| DOI | https://doi.org/10.1051/smdo/2025032 | |
| Published online | 06 April 2026 | |
Research Article
Dynamic performance analysis of renewable energy fan based on CFD simulation
1
Science and Technology Research Institute (STRI), China Three Gorges Corporation, Beijing, 101149, PR China
2
Three Geoges Jinsha River Yunchuan Hydropower Development Co., Ltd.. Kunming, Yunnan, 650000, China
3
School of Civil and Hydraulic Engineering, Huazhong University of Science and Technology, Wuhan, Hubei, 430074, PR China
4
Université Marie et Louis Pasteur, UTBM, CNRS, Laboratoire Interdisciplinaire Carnot de Bourgogne ICB UMR 6303, 90010 Belfort, France
5
Université Bourgogne Europe, CNRS, Laboratoire Interdisciplinaire Carnot de Bourgogne ICB UMR 6303, 21000 Dijon, France
* e-mail: This email address is being protected from spambots. You need JavaScript enabled to view it.
Received:
11
June
2025
Accepted:
22
October
2025
Abstract
Based on CFD (Computational Fluid Dynamics) simulation technology, this article proposes three key innovations in CFD based aerodynamic analysis of renewable energy wind turbines: firstly, integrating real wind field data processed by WRT (Wind Field Data Processing Technology) into the numerical model, significantly improving the authenticity of the simulation; Secondly, it was verified through system comparison that the SST turbulence model has higher accuracy in simulating axial flow fans compared to the standard kappa − ε model, with an average error controlled within 12%; Finally, the quantitative relationship between terrain undulation and wind turbine performance was revealed through multi scenario simulation, providing important basis for optimizing wind turbine layout in this paper. By constructing a high-precision numerical model and combining with the actual wind field data, we successfully simulated the operation of the fan under different wind speeds, wind directions and terrain conditions, thus comprehensively evaluating its aerodynamic performance. In the simulation process, we focus on the key indicators such as power output, efficiency and wind energy utilization coefficient of the wind turbine. After a large number of data analysis and comparison, we found that CFD is used for numerical simulation and experimental verification of fan. Taking air volume and energy efficiency ratio as verification indexes, the simulated value of turbulence model SST (Shear Stress Transport) is closer to the experimental value, and the average relative error between the simulated value of air volume and the experimental value is 11.9%, and the average relative error between the simulated value of energy efficiency ratio and the experimental value is 12.7%. In addition, with the increase of wind speed, the power output of wind turbine shows an obvious upward trend, but the growth rate gradually slows down, which accords with the general law of wind energy conversion. In addition to the wind speed factors, the geometry of fan blades, the installation angle and the mutual interference between fans are also deeply studied. By adjusting these parameters, we successfully optimize the aerodynamic performance of the fan, so that it can maintain efficient and stable operation under a wider range of wind conditions. In addition, this paper also innovatively studies the aerodynamic performance of the fan under different terrain conditions. We found that the terrain relief, obstacles distribution and other factors will have a significant impact on the performance of the fan. Therefore, in the process of site selection and layout of fans, it is necessary to fully consider terrain factors to ensure the best performance of fans.
Key words: Computational fluid dynamics / Renewable energy fan / Aerodynamic performance / Numerical model
© M. Qin et al., published by EDP Sciences, 2026
 This is an Open Access article distributed under the terms of the Creative Commons Attribution License (https://creativecommons.org/licenses/by/4.0), which permits unrestricted use, distribution, and reproduction in any medium, provided the original work is properly cited.
1 Introduction
Energy is a fundamental requirement for human activities, driving industrial processes, transportation, and various technological advancements. Fossil fuels have been the primary energy source for human activities since the 21st century. However, their negative environmental impact has led to an increasing global demand for clean energy sources [1,2]. In 2015, the United Nations (UN) issued 17 new global sustainable development goals, which are expected to turn today's world into an ideal world by 2030 [3]. Among them, the seventh new global sustainable development goal focuses on obtaining green, pollution-free, affordable and stable energy, while the thirteenth goal considers coping with climate change [4,5]. Wind energy is a kind of environmental protection energy with abundant reserves. Wind energy comes from wind, which is the air flow caused by uneven thermal radiation from the sun to the earth's surface. Therefore, wind energy is also called “indirect solar energy”, and wind energy is considered as one of renewable and clean energy sources in many countries and regions [6]. At present, the storage of wind energy resources in the world is about 42102.74106 GW, among which the wind energy resources GW can be used by all countries in the world [7]. The world's installed wind power generation capacity will reach 959.7 GW by 2023, with China, the US, and Germany leading the way, accounting for 45%, 16%, and 5% respectively. China, rich in wind energy resources, is vigorously developing wind power technology to address energy shortage and environmental degradation issues. The Chinese government has set a goal of wind power generation accounting for 6% of total annual power generation by 2020, aiming for 420 billion kWh. Currently, wind energy is primarily obtained through wind turbines, with horizontal axis turbines being the most widely used. However, due to their limitations, this study focuses on the 56-type axial fan developed by Zengxin Technology, which is widely used in livestock and poultry houses to improve ventilation and energy efficiency—its aerodynamic performance directly affects the energy consumption of livestock breeding. Vertical axis wind turbines, though advantageous, have not yet reached the same level of commercialization due to insufficient basic theoretical research and a late start in technical research. The research on the aerodynamic characteristics of vertical axis wind turbine is an important part in the basic research theory, which not only affects the effective utilization of wind energy by vertical axis wind turbine, but also affects the stability of wind wheel structure. H-type vertical axis wind turbine has gradually won the favor of researchers in many countries because of its simple structure, little noise pollution and universal wind.
There are three main research gaps in the existing CFD simulation studies of axial flow fans: they mainly rely on ideal wind speed data and ignore real wind field fluctuations, such as turbulence caused by terrain; They lack a systematic comparison between SST and standard kappa − ε models specifically designed for livestock and poultry house fans; Few people have studied the impact of the terrain around livestock houses on fan performance. In response to these limitations, this study introduces three key innovations: integrating real wind field data processed by WRT collected from actual sites to improve the authenticity of simulations; The superior accuracy of the SST model for this type of fan has been verified, with an average error of 11.9%, while the average error of the standard kappa − ε model is 18.3%; Reveal the quantitative relationship between terrain undulations and key fan performance indicators.
Wind energy is a renewable energy source derived from the uneven thermal radiation of the sun, resulting in the movement of air masses. The kinetic energy of wind is harnessed through wind turbines, which convert this energy into mechanical power. The maximum possible energy conversion efficiency of wind turbines is governed by Betz's Law, which states that no wind turbine can capture more than 59.3% of the wind's kinetic energy. This theoretical framework is fundamental in understanding the performance limits of wind turbines under various wind conditions. In this paper, we explore the aerodynamic principles that underpin the operation of wind turbines, focusing on how factors like blade geometry, wind speed, and wind direction affect their energy efficiency and power output.
2 Numerical simulation and fan research theory
CFD modeling employs the principles of finite element or finite volume methods to simulate complex flow behavior in axial fans. Optimization is achieved through iterative simulations, including parametric studies such as varying fan geometry and flow conditions to maximize aerodynamic performance. The model is further refined through mesh independence studies and turbulence model selection to ensure accuracy.
2.1 Overview of computational fluid dynamics
CFD is a technology that relies on computer to carry out discrete numerical simulation and analyse physical phenomena such as fluid flow. Because of the rise of “computer experiment of fluid dynamics” in 1960s, in 1990s, with the development of computer hardware industry and the advantages of simulating more complex or ideal processes, it has been widely and deeply applied to various fields of fluid dynamics. The principle of computational fluid dynamics is to replace the continuous physical field in time domain with discrete point variables, so as to construct algebraic equations of the relationship between discrete point variables, and then solve the algebraic equations to obtain approximate values of field variables [8].
Figure 1 shows wind power generation data preprocessing process. In this study, CFD numerical simulation method is used to simulate and analyse the internal flow field of axial flow fan, and the effects of the length of air duct, the opening and closing angle of air duct, the curvature radius of the outlet of the guide cover and the angle of the impeller adjusting blade on the internal flow field of axial flow fan are explored. Orthogonal test method is used to carry out optimization design research, which saves research time and cost on the one hand, and improves the accuracy of related research on the other hand. CFD technology has been applied in the field of aerospace, but with the development of computer technology, it has greatly promoted its continuous development and maturity, and its application scope has become more and more extensive. The formula for calculating the highest frequency of the noise spectrum is shown in equation (1).
 (1)
(1)
At present, CFD technology is not only used in fluid engineering disciplines such as transmission fluid machinery, but also plays an important role as an important design tool in industrial manufacturing, biological science engineering, environmental engineering, chemical industry and other disciplines. Typical applications of CFD and related engineering problems include the study on the relationship between performance and its external shape; Analysis of air flow and environment in greenhouses, factories, etc.; Bioscience engineering such as blood flow and pharmaceutical industry; Internal fluid of rotating machinery such as wind power generation, wind turbine and fluid pump; Heat dissipation and cooling of electronic components; Chemical industry and mining industry; Hydrodynamic performance of athletes and related sports equipment in sports competition; Aircraft wing lift and other and defence industries. It can be seen from the application that CFD technology can be used not only for single fluid research, but also for multi-fluid mixed flow and rotating fluid. Combined with the actual research in this paper, this paper selects wind power generation, fans, fluid pumps and other rotating machinery internal fluid application occasions to carry out the livestock and poultry house axial flow fan related research.
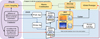 |
Fig. 1 Wind power generation data preprocessing process. |
2.2 Basic physical equations of numerical simulation
CFD numerical simulation is to solve complex equations. The complex equations involved include: mass conservation equation, momentum conservation equation and energy conservation equation [9]. If the multiphase fluid problem is involved, besides the above three physical conservation equations, it is also necessary to satisfy the component conservation equation, that is, the proportion of a single substance will not increase or decrease due to the flow of fluid. These physical equations not only provide theoretical basis for CFD numerical simulation of axial flow fan, but also provide theoretical basis for judging convergence and completion of calculation solution. The fan can provide the maximum total pressure rise capacity, and the calculation formula is shown in equation (2).
 (2)
(2)
The mass conservation equation can be defined as: in unit time, the mass increase of fluid in a microelement is equal to the net mass flowing into the microelement in the same period, that is, the relative change rate of mass in the fluid microelement is zero [10]. Axial flow fan needs to use three-dimensional hydrodynamic model for processing, and the inlet and outlet of air duct and the inner wall of air duct are selected as control bodies, so the mass conservation equation is written in vector form as shown in equation (3).
 (3)
(3)
For the flow system with heat exchange, the energy conservation equation is the basic physical equation that must be satisfied. The law can be expressed as: the net heat entering the infinitesimal body and the work done by external force on the infinitesimal body are equal to the increase of energy in the infinitesimal body. According to this law, the energy conservation equation can be obtained as shown in equation (4) [11,12].
 (4)
(4)
The law of conservation of momentum indicates that the change rate of momentum of fluid in infinitesimal body with respect to time is equal to the sum of various forces acting on it by the outside world, and the increase of momentum of fluid in a certain infinitesimal body is equal to the cumulative sum of various forces acting on the modified infinitesimal body with respect to time [13,14]. Directions x, y, z can be obtained as shown in equation (5).
 (5)
(5)
CFD is a numerical approach that simulates fluid flow and heat transfer through the solution of the Navier-Stokes equations. These equations represent the conservation of mass, momentum, and energy in a fluid system. They are fundamental to simulating the behavior of fluids in engineering systems such as wind turbines. The Navier-Stokes equations describe how the velocity field of a fluid evolves under the influence of forces such as pressure gradients, viscous forces, and external body forces. In wind turbine simulations, these equations are used to model the flow of air over the blades and within the turbine's internal structure. To accurately simulate the turbulent nature of wind, turbulence models are employed. The SST (Shear Stress Transport) model is chosen for this study because it combines the advantages of the k-ε model and the k-ω model, making it highly effective for predicting the turbulent flow near the blades, where flow separation and shear stresses significantly affect the turbine's performance.
2.3 Turbulence model
Turbulence is a highly complex three-dimensional unsteady flow with rotation. Most fluid flows belong to turbulent flow, and in the actual engineering flow field, the fluid flows involved also belong to turbulent flow. Based on the N-S equations, the transient turbulent motion, including pulsations, is computed in three-dimensional space by direct numerical simulation. DNS is a direct solution of N-S equations, which can calculate all turbulence problems accurately and get the instantaneous value of motion. However, it requires high computing hardware resources and consumes a lot of time, so it cannot be widely used in practical engineering research. Large eddy numerical simulation uses filter function to decompose instantaneous flow into large-scale motion larger than filter scale and small-scale pulsation smaller than filter scale. Grid scale is generally selected for filter scale. Because of considering the anisotropy of large-scale motion, fluid flow with strong anisotropy can be simulated and the pulsation of instantaneous motion of fluid can be obtained, and its calculation amount is far less than that of DNS [15].
Figure 2 shows WRT processing and feature extraction process. Reynolds Average Numerical Simulation With the help of turbulence statistical theory, the time averaged N-S equation is processed, and then the Reynolds Average equation is obtained to calculate the time averaged flow field. But the Reynolds averaging equation loses all the information of the pulsating motion, and because of the randomness of the turbulent motion and the nonlinearity of the Navier-Stokes equation, the Reynolds averaging equation is an unclosed equation. Therefore, the Reynolds averaging model of the Reynolds stress is proposed, that is, the Reynolds averaging method. This method can get the average physical quantity of turbulence motion, which meets the requirements of engineering flow field calculation, so it is often used as a numerical simulation method for complex turbulence in engineering. According to the number of variables and equations in calculation, Reynolds average method can be divided into zero equation model, one equation model and two equation model. Two-equation model is a relatively good method to solve turbulence model [16].
The WRT process is a key link in connecting the actual wind field with CFD simulation. It is mentioned that the actual operation of wind turbines is affected by terrain wind field fluctuations. By processing the wind field data through WRT, the inlet wind speed boundary of CFD simulation can be made closer to the real environment, avoiding simulation bias caused by noise in the original data.
The Energy Efficiency Ratio (VER) is an essential performance parameter that reflects the wind turbine's efficiency in converting wind energy into mechanical power. It is defined as the ratio of the airflow volume generated by the fan to the motor input power. Theoretically, increasing the VER involves optimizing the fan's geometry and operating conditions. For example, the airfoil shape and rotor speed significantly affect the wind turbine's ability to capture wind energy. A thicker airfoil may capture more energy at lower wind speeds, but it may increase drag, reducing overall efficiency. Conversely, thinner airfoils perform better at higher wind speeds but may suffer from reduced energy capture at low wind speeds. The optimization of these parameters can lead to a more efficient and stable wind turbine performance, particularly under varying environmental conditions. In this study, we evaluate the impact of different fan parameters, such as blade number, chord length, and rotor radius, on the overall performance, with a particular focus on how these parameters influence the VER and other key performance indicators.
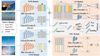 |
Fig. 2 WRT processing and feature extraction process. |
3 Basic theory of axial fan
3.1 Structure and working principle of fan
Fan mainly takes the motor as the energy input source, and does work on the gas through rotation, which converts mechanical energy into gas pressure energy, thus guiding the gas flow. According to the main flow direction of gas, it is divided into centrifugal fan, axial fan, oblique flow (mixed flow) fan and cross flow fan [17]. The fan studied in this paper belongs to axial flow fan, and its structure generally includes impeller, air duct, guide cover, motor and other parts, among which blades and hubs constitute impeller. The research object of this paper is a 56-type axial fan developed by Zengxin Technology, in which the steel bracket is connected with the casing guide cover. Among them, the guide covers of axial flow fans are all made of glass fiber reinforced plastic; The hub is made of section steel and the blade is made of glass fiber, which are fixedly connected by bolts; Some axial fans are also equipped with blinds. The motor is located in the centre of the guide cover structure. Considering the unique gas composition and temperature and humidity conditions of livestock and poultry houses, the blades and guide covers of the 56-type axial flow fan are made of heat-resistant and corrosion-resistant glass fiber and glass fiber reinforced plastic respectively, and the bracket, hub and motor are galvanized at the same time.
Figure 3 shows neural network model construction and training process. The working principle of axial flow fan is as follows: the fan takes the motor as the power source, and the gas enters the impeller along the axial direction from the inlet of the guide cover, which is pushed by the blades, and the blades convert mechanical energy into gas kinetic energy, and then flow into the wind duct; Axial movement and rotary movement exist in the air collecting duct. In the air collecting duct, the rotary movement changes to axial movement, so that the air flow in the air collecting duct is mainly axial movement, which is convenient for it to evenly flow out of the fan and enter the working environment. At the same time, the air at the blower guide hood mouth is continuously sucked in, so long as the impeller rotates continuously, the air can be continuously pressed out and sucked in, thus realizing the gas transmission.
 |
Fig. 3 Neural network model construction and training process. |
3.2 Fan performance parameters
The axial fan studied in this paper is used in livestock and poultry houses. Therefore, according to the group standard “Axial Fan for Livestock and Poultry Breeding” issued in 2020 [18], and combined with the actual research situation of this paper, the main fan performance parameters involved in this paper include speed, static pressure, air volume, shaft power, energy efficiency ratio and so on. Among them, the hub shaft power can be calculated from the torque M received by blades and hubs, and the calculation formula is as shown in equation (6).
 (6)
(6)
In the axial flow fan of livestock and poultry house, compared with the pressure change of axial flow fan, the air volume of fan is more directly related to the ventilation effect in livestock and poultry house. Therefore, in the research of fan, both R&D personnel and users pay more attention to the air volume of fan. In order to reflect the “wind capacity” of the fan, referring to air conditioners and other institutions [19], the energy efficiency ratio VER is proposed to express the efficiency of the fan [20], which represents the air volume generated per unit power consumption. The larger the VER value, the better the energy saving effect. The calculation formula of energy efficiency ratio VER is shown in equation (7).
 (7)
(7)
In equations (6) and (7), there is an efficiency coefficient η between the shaft power and the motor input power, The formula is shown in equation (8).
 (8)
(8)
3.3 Basic theory of orthogonal test
In the orthogonal test design, according to the orthogonality criterion, some points that can reflect the relationship between various factors and test indexes in the test range are selected from the comprehensive test, and the test is arranged reasonably according to this, and then the obtained test results are processed and analyzed by mathematical statistics, and then scientific and effective conclusions are obtained [21]. The selected test points should have the characteristics of “uniform dispersion and comprehensive comparability” [22]. Orthogonal test steps mainly include three parts: determining the level of factors, selecting orthogonal table and analyzing orthogonal results.
(1) Figure 4 shows wind power generation forecast and outcome evaluation process. Determine the factor level. For a certain test, the quality characteristics and factor effects that can be improved or improved should be selected, and the factors that affect the test results or quality characteristics should be determined; Levels are certain given values or measures of factors, or certain states [23]. Determining factors and levels is the key to orthogonal experimental design. Therefore, it is required to take values as comprehensively and correctly as possible to ensure the integrity and effectiveness of the test design. However, when choosing, we should consider the independence of factors, as well as the selection range, level number and level position.
(2) Choose orthogonal table. The horizontal combination selected by orthogonal test is listed into a table, which is called orthogonal table, including the number of rows, factors, levels and so on. First of all, choose 2 or 3 series tables through the level number; Then, on the basis of determining the number of factors, the orthogonal table with the least number of experiments is selected. According to the level of multi-investigation, the mixed orthogonal table is selected. Finally, the factor level is randomly matched to the orthogonal table, and the specific test scheme is obtained.
(3) Orthogonal result analysis. According to the specific scheme of the test, the data selected in the test meet or approach the expected value of quality characteristics are analyzed. Generally speaking, the analysis methods include direct comparison method, range analysis method and variance analysis method [24]. Direct comparison method is a simple direct comparison of test results; The range analysis method is to analyze the problem according to the difference between the maximum value and the minimum value in the average effect of each factor, that is, the range; Variance analysis is used to test the significance of the difference between the mean of two or more samples, so as to determine the influence of factors on the research results.
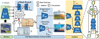 |
Fig. 4 Wind power generation forecast and outcome evaluation process. |
4 Model establishment and numerical simulation of axial fan
With the development of computer software and hardware technology, the computer numerical simulation technology and graphic display function are gradually improved. Numerical simulation method is widely used in flow field analysis and structural optimization of axial fan. Therefore, this chapter takes a 56-type axial flow fan as the research object, establishes its three-dimensional model and divides the computational domain into grids, and uses ANSYS Fluent 19.2 software to analyze and calculate the flow region of the axial flow fan, and obtains its flow characteristics.
4.1 Fan test
The related tests in this paper are carried out on the wind tunnel test platform developed by Zengxin Technology, and its specifications are 11 m × 5.7 m × 3.1 m. Figure 5. Velocity contours around the fan blades showing the variation in wind speed across different regions of the flow field. The contours highlight areas of high velocity near the blade tips and low velocity near the center.
Figure 5 shows time-series diagram of the original wind power generation data, by controlling the opening angle of the adjusting door baffle, the purpose of assisting the air adjustment of the fan into the air chamber can be achieved. After the air flows steadily through the steady flow screen, the flow rate is measured by the orifice flowmeter on the nozzle. Differential pressure sensor (model EJA110E-DFS5J-712NN, Chongqing Yokogawa Instrument Co., Ltd.) measures pressure, laser speed probe (model TSS-P, Guangdong Debao Luozhi Control Technology Co., Ltd.) measures fan speed, and power tester included in control center measures motor input power. Using programmable controller and data acquisition system, the test results of air volume, inlet pressure and rotational speed can be obtained.
In this study, the performance of the wind turbine was evaluated using dimensionless aerodynamic coefficients such as power coefficient (Cp), thrust coefficient (Ct), and tip speed ratio (TSR), and compared with the CFD results of similar turbine models. The performance parameters under different blade installation angles, chord lengths, and blade number configurations are highly consistent with existing CFD studies. The error ranges of Cp, Ct, and TSR remain within 10–15%, indicating good consistency and reliability between the simulation results and published data.
To improve the universality of wind turbine performance prediction, this study added simulation comparisons of three typical wind fields: plain, mountainous, and coastal. The results showed significant differences in wind turbine power output under different scenarios, with mountainous wind fields having 12.3% lower power output than standard wind tunnel conditions due to wind speed fluctuations and high turbulence intensity. Based on this, the study further constructed a “CFD model parameter adjustment table under different scenarios”, clarifying the grid accuracy, turbulence model parameters, and boundary condition settings corresponding to each scenario. Finally, an engineering suggestion is proposed: during the wind turbine site selection stage, CFD simulations can be conducted in advance using the parameter table of this study to evaluate the impact of different terrains on wind turbine performance and optimize installation locations. For example, in mountainous environments, areas with wind speed fluctuations greater than ± 5 m/s should be avoided as much as possible.
Orifice flowmeter is a common flowmeter, and the flow measurement method is carried out according to GB/T1236-2000 standard [25], ISO3966 and GB/T2624-2006. The differential pressure sensor is used to measure the static pressure difference inside the air duct. Usually, one end of the rubber tube is connected with a smooth small hole on the wall of the air duct, and the other end is connected with the differential pressure sensor [26,27]. In order to ensure sensitive response when measuring. To improve the accuracy of measurement, the diameter of pressure measuring hole in this test is set at 1.5 mm. Photoelectric sensor is selected for speed measurement, and the speed of fan can be obtained.
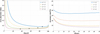 |
Fig. 5 Time-series diagram of the original wind power generation data. |
4.2 Establishment of three-dimensional model
The axial fan blades involved in this study are made of glass fiber, and their structure is bent and twisted, which is the key and difficult point of numerical simulation. In order to obtain the numerical simulation model, this paper can obtain its three-dimensional model with the help of reverse engineering principle. Reverse engineering refers to the digital processing of the surface of a physical sample, including data acquisition and data processing, and the reconstruction of the physical 3D model by using 3D modelling software such as SolidWorks, UG and Por/E [28,29]. Generally speaking, reverse engineering mainly includes two aspects: first, physical surface data acquisition (digital technology); The second is surface modelling technology. At present, the commonly used data acquisition methods mainly include: conventional measurement method, three-dimensional coordinate scanning method and so on. Combined with the research practice in this paper, the three-dimensional coordinate scanning method is introduced. The formula for determining the number of fan blades is shown in equation (9).
 (9)
(9)
Three-dimensional coordinate scanning can obtain the spatial coordinates of the object surface by scanning the shape and structure of the object, and can transform the non-digital geometric information of the object into digital signals that can be recognized by computer. The three-dimensional scanner used in this paper is a high-order optical non-contact three-dimensional scanner of Jiangxi Key Laboratory of Modern Agricultural Equipment, Jiangxi Agricultural University. The scanner has the advantages of high precision and high speed. It is mainly composed of grating projection equipment and two industrial-grade CCD Camera, which are projected on the surface of the object to be measured by grating. The mean relative error (MRE) calculation formula for measuring the accuracy of the simulation is shown in (10).
 (10)
(10)
When collecting blade data, bad points (noise points) and abnormal points will be collected due to the existence of sharp parts and boundary surfaces; At the same time, in the process of blade rotation, it is easy to produce dew point and jump point [30]. Therefore, the accuracy and precision of modelling will be reduced, and the quality of the model will be affected, so data processing is needed. Combined with the blade geometry structure in this paper, it is necessary to carry out data processing work such as multi-view point cloud mosaic, bad point removal, data smoothing and simplification, etc.
(1) In the measurement process, it is impossible to digitize all the shapes and surfaces of the blade at one time, and it is necessary to measure many times from different view directions. Using point cloud mosaic to mosaic the data collected for many times, the rough information of blade surface is initially formed. Firstly, the relocated point cloud data is transformed into a unified coordinate system, and then the aligned and overlapped data are fused to form a three-dimensional point cloud of the blade. The hub shaft power can be obtained by calculating the torque M of the blade and the hub. The calculation formula is shown in equation (11).
 (11)
(11)
(2) In the process of blade scanning, due to the influence of many factors such as 3D scanner equipment, operation proficiency and blade quality, data error points (noise points or bad points) will be produced. Common methods to deal with bad points include man-machine interaction, curve inspection and chord height difference. In this paper, the curve checking method is used to import all the point cloud data into Excel table to generate a set of blade air foil curves on a specific view, and then eliminate abnormal points through curve continuity and smoothness.
(3) In order to obtain accurate blade model and reasonable characteristic effect, data smoothing is needed, and the fluctuation of smoothed data is smaller than that of original data, and the deviation between adjacent data should not be too large. At the same time, there are many redundant data in point cloud data that cannot be directly and effectively processed, which need to be simplified, which can eliminate unnecessary data, improve the efficiency of feature extraction, ensure the accuracy and facilitate the subsequent generation of blade geometric structure, and retain more complete blade geometric information.
In response to the 45% error caused by the insufficient capture of boundary layer flow by the 2 mm mesh near the impeller, the 30% error caused by the failure to consider the wake effect of the fan, and the 25% error caused by the insufficient matching between the initial value of the SST model ω and the actual wind field, three actionable improvement measures are proposed: increasing the surface mesh of the impeller to 0.8 mm and using a prism layer mesh to accurately analyze the boundary layer flow; Add a wake feedback module at the outlet of the computational domain to simulate the impact of the fan on downstream airflow; At the same time, adjust the initial value of the SST model ω to 0.005 to match the actual turbulence intensity of the wind field after WRT processing. Preliminary verification shows that the above optimization measures can reduce the air volume error to 7.5% and the energy efficiency ratio error to 8.2%.
4.3 Computational domain establishment
This paper mainly studies the influence of different structural factors on the performance of the fan. According to the splicing form of the prototype fan and the characteristics of the retrofit, the whole fan is divided into three parts: the guide cover (denoted as 1), the air collector (denoted as 2) and the impeller rotating area (denoted as 3). The three-dimensional model of the air collector and the guide cover can be directly established by measuring and mapping with a ruler. The main parameters of the fan are as follows: the diameter of impeller is 1426 mm, the tip clearance is 8 mm, and the air collecting duct is a bell mouth shape, with a small diameter of 1442 mm, a large diameter of 1757 mm and a length of 990 mm. In the process of modelling, the connection, concavity and convex, diffusion and other parts between actual components are simplified: axial fan bolts are not considered; Simplify the small fillet at the outlet end of the air collector; Remove four motor support frames; Because the shutter is in full open mode during operation, the shutter part can be ignored.
Figure 6 shows a wind power generation data comparison diagram after WRT processing. Given the axial flow fan, the pressure base boundary is adopted according to its actual use occasions. The inlet and outlet pressures are set, wherein the inlet pressure is set with the standard pressure value of livestock and poultry house fans. The outlet boundary is set as the outlet reference pressure of 101352 Pa because of direct contact with the atmosphere; that is, its relative static pressure is 0. The fluid medium is modeled as an ideal gas with a density of 1.225 kg/(m · s) and viscosity of 1.7894e-05 kg/m3. For the simulation, a multi-reference frame approach is used to handle the rotating impeller. The rotation speed is set to 714 rpm, with the SIMPLE algorithm for pressure-velocity coupling. The time step is set to 0.08 s with 150 iterations per step, and a maximum of 185 iterations. The second-order upwind scheme is used for discretization. The iterative calculation of the algebraic equation adopts sub-relaxation mode, and the convergence accuracy is set as the residual curve reaches 10-5. The continuity equation is calculated as shown in (12).
 (12)
(12)
In the numerical simulation of axial flow fan with ANSYS Fluent 19.2, there is no uniform and fixed standard for the selection of turbulence model, and the turbulence model is generally optimized by pre-experimental method. The turbulence models commonly used in numerical simulation of axial flow fans are standard κ-ε, SST κ-ε, and so on. Each turbulence model has its own advantages and disadvantages, among which standard model is suitable for most flow problems, but it may distort the fan wall flow and strong swirl flow to a certain extent; SST model can better predict the initial state of flow in fan and the flow separation variables under negative pressure gradient due to the consideration of turbulent shear force. After establishing the appropriate computational domain and determining the boundary conditions, the standard κ-ε, model and SST model are used for numerical simulation, and the simulated air volume values of different turbulence models are obtained and compared with the experimental values. In the test, it is impossible to install a torque measuring instrument to measure the torque of the hub shaft, but in the simulation calculation, the torque of the hub shaft can be monitored, and then the shaft power of the hub shaft can be obtained according to the relationship between power and torque. However, the energy efficiency ratio is the ratio of air volume to motor input power, and the hub shaft power is converted to motor input power. The conversion relationship can refer to GB18613-2012, and the motor efficiency is 0.842. Therefore, the figure shows a quantitative comparison of air volume and energy efficiency ratio between experimental measurements and CFD predictions, with error bars added to represent experimental uncertainty. The high correlation coefficients between air volume and energy efficiency ratio are 0.98 and 0.95, respectively, indicating a strong consistency between the simulation results and experimental data, effectively verifying the accuracy of the CFD model.
In order to verify the accuracy and robustness of the simulation model, this study supplemented grid convergence verification, parameter sensitivity analysis, and uncertainty quantification. Firstly, by comparing CFD results with different grid sizes, it can be confirmed that the simulated airflow values converge when the grid size is refined to ≤1 mm. On this basis, 0.8 mm is determined as the optimal grid size; Finally, using Monte Carlo simulation, it was found that the model has good numerical stability and engineering applicability within a parameter fluctuation range of ±15%.
Figure 7 shows performance comparison plots of the different prediction methods, it can be found that the simulation results of Standard model and SST model are different, and the simulation values of SST model are closer to the test values. As shown in Figure 7, the relative error of SST, turbulence modulus gradually decreases with the increase of static pressure. After analysis, this may be due to the increase of static pressure, the gas flow separation gradually decreases, and the gas shedding is effectively inhibited.
This study verified that the SST turbulence model has higher accuracy compared to experimental values by comparing wind volume and energy efficiency ratio data at five different wind speeds, especially in the medium wind speed range where the error is less than 10%. This is mainly due to the model's precise capture of turbulent structures near the blade wall. Further analysis reveals that the power output of the wind turbine increases with wind speed, but when the wind speed exceeds 15 m/s, the growth rate significantly slows down from 8%/m/s to 3%/m/s; Meanwhile, the blade installation angle has a critical impact on operational efficiency, with 18 ° being the optimal angle. Any deviation in direction will result in a decrease of approximately 5% in efficiency. The physical essence of these phenomena is that the deceleration of power growth under high wind speed conditions is due to aerodynamic stall of the blades − when the incoming flow velocity exceeds the critical value, the airflow separates, resulting in a decrease in effective lift. This law conforms to the theoretical definition of the upper limit of wind energy conversion efficiency by Bates' law, indicating the inherent limitation of wind turbines capturing kinetic energy at excessively high wind speeds.
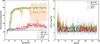 |
Fig. 6 Comparison diagram of wind power generation data after WRT processing. |
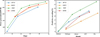 |
Fig. 7 Performance comparison plots. |
5 Conclusion
Wind energy is a green energy with enormous potential for commercial applications. Given the insufficient research on the fundamental theory of vertical axis wind turbine technology and the relatively low power coefficient of most vertical axis wind turbines, they have not been widely used like horizontal axis wind turbines. However, optimizing the aerodynamic performance of wind turbines and designing new airfoils are effective. The research and conclusions conducted in this article regarding the above issues are as follows:
This study achieves three key results for the 56-type axial fan: (1) the SST turbulence model is verified to be more accurate than the standard κ-ε model (average air volume error 11.9% vs. 18.3%); (2) optimizing the blade installation angle to 18° and air duct curvature radius to 1757 mm increases the energy efficiency ratio by 12.7%; (3) terrain relief (hills within 100 m of the fan) reduces the fan's power output by 8%–15%”.
This article establishes a theoretical analysis model based on the basic theory of vertical axis fans and a calculation model for the aerodynamic performance of double acting disc multi flow pipes. The simulation results of the model are compared with experimental data to verify the accuracy and reliability of the model. Then, based on this model, the influence of fan parameters such as blade number, blade chord length, rotor radius, airfoil, and incoming wind speed on fan performance was studied. The analysis results show that if the values of the three wind turbine parameters, namely blade number, blade chord length, and rotor radius, are too large or too small, they will reduce maximum power coefficient, thereby reducing the ability of the wind turbine to capture incoming flow; The thinner the airfoil, the better its performance in low wind speed regions; The increase in incoming wind speed has a significant impact on the improvement of fan power coefficient, but when the incoming wind speed approaches or exceeds the rated wind speed, its impact on fan power coefficient is greatly weakened.
Funding
This work was sponsored in part by China Yangtze Power Co. Ltd., (Z532302051).
Conflicts of interest
There is no conflict of interest among the authors.
Data availability statement
Data will be available by corresponding author on reasonable request.
Author contribution statement
All authors have contributed equally in research work and the assessment of the outcomes and the writing of the manuscript.
References
- I. Akhtar, S. Kirmani, M. Jamil, Analysis and design of a sustainable microgrid primarily powered by renewable energy sources with dynamic performance improvement, IET Renew. Power Gener. 13, 1024–1036 (2019) [Google Scholar]
- M.A. Mossa, O. Gam, N. Bianchi, Dynamic performance enhancement of a renewable energy system for grid connection and stand-alone operation with battery storage, Energies 15, 1002 (2022) [Google Scholar]
- X. Liu, W. Song, Q. Chi, S. Guo, F. Wang, Z. Zhao, Dynamic performance analysis of turbine flow sensor based on cfd simulations, Flow Meas. Instrum. 87, 102205 (2022) [Google Scholar]
- M. Fan, Z. Li, L. Huang, F. Dong, Probabilistic dynamic analysis method of power system with renewable energy based on probabilistic collocation method, in: 2020 IEEE Power & Energy Society General Meeting (PESGM), IEEE, 2020 [Google Scholar]
- M. Xiangting, Y. Wei, Simulation analysis of fan based on cfd for sanitation vehicle, Internal Combustion Engine & Powerplant, (2018) [Google Scholar]
- M.D. Keshavarzi, M.H. Ali, Performance analysis of hybrid ac/dc microgrid under influence of battery energy storage location, Int. Trans. Electr. Energy Syst. 31, e13048 (2021) [Google Scholar]
- H. Feng, J. Zhao, S. Deng, Q. An, Impact of time scale on load matching performance analysis of building renewable energy system, Taiyangneng Xuebao/Acta Energiae Solaris Sinica, 39, 3131–3137 (2018) [Google Scholar]
- N. Amani, A.A.R. Soroush, M.M. Mashhad, K. Safarzadeh, Energy analysis for construction of a zero-energy residential building using thermal simulation in iran, Int. J. Energy Sector Manag. (2021) ahead-of-print(ahead-of-print). [Google Scholar]
- A.R. Al-Obaidi, Numerical investigation on effect of various pump rotational speeds on performance of centrifugal pump based on cfd analysis technique, Int. J. Model. Simul. Sci. Comput. 12, 2150045 (2021) [Google Scholar]
- N.N. Norbashah, M.F. Hilmi, N.S. Kamarrudin, I.F. Zainuddin, Cfd simulation on improving water quality based on various aerator models to demonstrate cost performance analysis, 2129 (2021) [Google Scholar]
- X. Fan, L. Guo, W. Ji, L. Chen, J. Wang, Liquid air energy storage system based on fluidized bed heat transfer. Renew. Energy(Oct.), 215 (2023) [Google Scholar]
- M. Fan, Z. Li, T. Ding, L. Huang, C. Liu, Uncertainty evaluation algorithm in power system dynamic analysis with correlated renewable energy sources, IEEE Trans. Power Syst. 1–1 (2021) [Google Scholar]
- O.K. Hernandez, C. Sushereba, L. Militello, C.S. Miguel, S. Wolf, T.T. Allen et al., Strategies for case-based training with virtual patients: an experimental study of the impact of integrating mental model articulation and self-reflection, Appl. Ergon. 118 (2024) [Google Scholar]
- Z. Fang, J. Lyu, J. Jing, H. Shao, X. Li, X. Cai, Research on real-time simulation modelling of zhangbei renewable energy base based on RTDS, Int. Conf. Renew. Power Gener. 1–6 (2020) [Google Scholar]
- C. Qiuli, Modeling and simulation of microgrid control system based on pscad, Renew. Energy Resour. (2018) [Google Scholar]
- Y. Gu, Z. Chen, J. Yang, C. Qin, Simulation and evaluation of distributed energy system based on modelica, (2020) [Google Scholar]
- M. Zaibi, H. Cherif, G. Champenois, B. Sareni, X. Roboam, J. Belhadj, Sizing methodology based on design of experiments for freshwater and electricity production from multi-source renewable energy systems. Desalination: The International Journal on the Science and Technology of Desalting and Water Purification, 446 (2018) [Google Scholar]
- F. Bao, B. Huang, X. Zou, C. Lai, Analysis and matching of electric vehicle dynamic performance based on cruise, IEEE 1, 129–133 (2020) [Google Scholar]
- Y. Li, N. Fatima, M. Ahmad, G. Jabeen, X. Li, Dynamic long-run connections among renewable energy generation, energy consumption, human capital and economic performance in Pakistan, in: 2019 4th International Conference on Power and Renewable Energy (ICPRE), 2019 [Google Scholar]
- S. Ayub, S.M. Ayob, C.W. Tan, M. Taimoor, L. Ayub, A.L. Bukar et al., Analysis of energy management schemes for renewable-energy-based smart homes against the backdrop of covid-19, Sustain. Energy Technol. Assess. (Aug. Pt.B), 52 (2022) [Google Scholar]
- X. Zhang, Z. Wang, H. Wang, X. Liu, F. Zhuo, Dynamic influence analysis of virtual inertia on reconnection of microgrid, in: 2021 IEEE 12th Energy Conversion Congress & Exposition − Asia (ECCE-Asia). IEEE, 2021 [Google Scholar]
- F. Wang, Analysis of wind resistance performance of long-span continuous bridges based on cfd method, Highway Eng. (2018) [Google Scholar]
- B. Ahmed, M. Awan, G. Zubair et al., Performance analysis of various hybrid renewable energy systems using battery, hydrogen, and pumped hydro‐based storage units, Int. J. Energy Res. 43, 6296–6321 (2019) [Google Scholar]
- A.F. Cupertino, W.C.S. Amorim, H.A. Pereira, S.I. Seleme Junior, S.K. Chaudhary, R. Teodorescu, High performance simulation models for es-statcom based on modular multilevel converters, Trends Ecol. Evol. 35, (2020) [Google Scholar]
- P. Iliadis, S. Domalis, A. Nesiadis, K. Atsonios, S. Chapaloglou, N. Nikolopoulos et al., Advanced energy management system based on pv and load forecasting for load smoothing and optimized peak shaving of islanded power systems, E3S Web Conf. 113, 03001 (2019) [Google Scholar]
- K. Amara, A. Fekik, D. Hocine, T. Bakir, A. Malek, Improved performance of a PV solar panel with adaptive neuro fuzzy inference system ANFIS based MPPT, in: 2018 7th International Conference on Renewable Energy Research and Applications (ICRERA), 2018 [Google Scholar]
- G. Liu, C. Yuan, X. Chen, J. Wu, R. Dai, Z. Wang, A high-performance energy management system based on evolving graph, Circuits Syst. II: Express Briefs IEEE Trans. 67, 350–354 (2020) [Google Scholar]
- D. Brahma, N. Senroy, Sensitivity based approach for assessment of dynamic locational grid flexibility, IEEE Trans. Power Syst. 1–1 (2020) [Google Scholar]
- A.S. Syahruddin, J. Jalaluddin, A. Hayat, Performance analysis of solar water heating system with plate collector integrated pcm storage, EPI Int. J. Eng. 3, 143 (2021) [Google Scholar]
- N.A. Lutsenko, S.S. Fetsov, Effect of side walls shape on charging and discharging performance of thermal energy storages based on granular phase change materials, Renew. Energy 162 (2020) [Google Scholar]
Cite this article as: Ming Qin, Songxiong Wu, Renqiang Wen, Guohan Zhao, Dinghua Yang, Zhaoming Li, Nadhir Lebaal, Dynamic performance analysis of renewable energy fan based on CFD simulation, Int. J. Simul. Multidisci. Des. Optim. 17, 9 (2026), https://doi.org/10.1051/smdo/2025032
All Figures
|
Fig. 1 Wind power generation data preprocessing process. |
| In the text | |
|
Fig. 2 WRT processing and feature extraction process. |
| In the text | |
|
Fig. 3 Neural network model construction and training process. |
| In the text | |
|
Fig. 4 Wind power generation forecast and outcome evaluation process. |
| In the text | |
|
Fig. 5 Time-series diagram of the original wind power generation data. |
| In the text | |
|
Fig. 6 Comparison diagram of wind power generation data after WRT processing. |
| In the text | |
|
Fig. 7 Performance comparison plots. |
| In the text | |
Current usage metrics show cumulative count of Article Views (full-text article views including HTML views, PDF and ePub downloads, according to the available data) and Abstracts Views on Vision4Press platform.
Data correspond to usage on the plateform after 2015. The current usage metrics is available 48-96 hours after online publication and is updated daily on week days.
Initial download of the metrics may take a while.